Same ruck timing, 12 points apart
2026, finals included · ruck speed allowed: how long the other team took to play the ball, on averageWarriors 2026
3.55sslowest ruck of 17
- Points conceded a game
- 17.5
- Won
- 18 of 26
Dragons 2026
3.53s4th-slowest ruck of 17
- Points conceded a game
- 29.9
- Won
- 5 of 24
Show the numbers
| Club | Ruck speed allowed (s) | Metres given up a game | Points let in a game | Won |
|---|---|---|---|---|
| New Zealand Warriors | 3.55 | 1,513 | 17.5 | 18 of 26 |
| North Queensland Cowboys | 3.54 | 1,771 | 27.1 | 13 of 25 |
| Wests Tigers | 3.54 | 1,733 | 29.1 | 8 of 24 |
| St George Illawarra Dragons | 3.53 | 1,901 | 29.9 | 5 of 24 |
| Melbourne Storm | 3.53 | 1,650 | 24.0 | 11 of 24 |
| Canberra Raiders | 3.53 | 1,713 | 26.1 | 11 of 24 |
| Penrith Panthers | 3.51 | 1,578 | 14.7 | 19 of 26 |
| Brisbane Broncos | 3.49 | 1,813 | 28.2 | 8 of 24 |
| Dolphins | 3.49 | 1,666 | 21.5 | 18 of 26 |
| Manly Sea Eagles | 3.48 | 1,608 | 21.8 | 11 of 24 |
| Gold Coast Titans | 3.47 | 1,844 | 27.6 | 6 of 24 |
| Sydney Roosters | 3.46 | 1,558 | 20.3 | 19 of 28 |
| Parramatta Eels | 3.45 | 1,795 | 28.3 | 9 of 24 |
| Newcastle Knights | 3.45 | 1,747 | 23.0 | 17 of 28 |
| Canterbury Bulldogs | 3.42 | 1,575 | 22.3 | 11 of 24 |
| Cronulla Sharks | 3.36 | 1,518 | 22.5 | 15 of 26 |
| South Sydney Rabbitohs | 3.33 | 1,652 | 24.0 | 14 of 25 |
Why?
A follower DM'd us a proper footy question:
Can you look at line speed in defence? Which is better, a faster or slower line speed?A follower's DM, October 2026
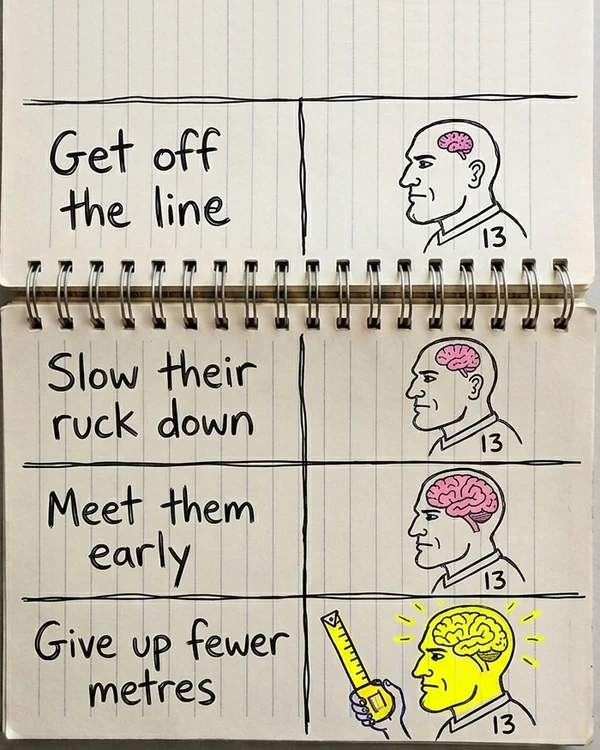
It's simple, right?
- Get off the line
- Slow their ruck
- Win the game?
So I checked all 1,254 NRL games since 2021.
The ruck timing
Nobody publishes line speed. It lives in the clubs' GPS data. The closest public number is the ruck: how long teams take to play the ball against you. A slower ruck means the defence won the tackle.
In 2026 the Warriors forced the slowest ruck in the NRL. The pundits noticed:
Flying off the line and just absolutely tearing into their forwards… They're a top two defence, and that's what wins comps.
But the Dragons' ruck timing was the same, and they let in the most points in the NRL (Figure 1).
One-off? Here's every defence since 2021.
The ruck timing: a flat cloud. The metre counter: a climb
every NRL defence, 2021 to 2026, finals included · one dot a club-season · flip the switchShow the numbers
| Season | Club | Games | Ruck speed allowed (s) | Metres given up a game | Points let in a game | Won |
|---|---|---|---|---|---|---|
| 2026 | New Zealand Warriors | 26 | 3.55 | 1,513 | 17.5 | 18 of 26 |
| 2026 | North Queensland Cowboys | 25 | 3.54 | 1,771 | 27.1 | 13 of 25 |
| 2026 | Wests Tigers | 24 | 3.54 | 1,733 | 29.1 | 8 of 24 |
| 2026 | St George Illawarra Dragons | 24 | 3.53 | 1,901 | 29.9 | 5 of 24 |
| 2026 | Melbourne Storm | 24 | 3.53 | 1,650 | 24.0 | 11 of 24 |
| 2026 | Canberra Raiders | 24 | 3.53 | 1,713 | 26.1 | 11 of 24 |
| 2026 | Penrith Panthers | 26 | 3.51 | 1,578 | 14.7 | 19 of 26 |
| 2026 | Brisbane Broncos | 24 | 3.49 | 1,813 | 28.2 | 8 of 24 |
| 2026 | Dolphins | 26 | 3.49 | 1,666 | 21.5 | 18 of 26 |
| 2026 | Manly Sea Eagles | 24 | 3.48 | 1,608 | 21.8 | 11 of 24 |
| 2026 | Gold Coast Titans | 24 | 3.47 | 1,844 | 27.6 | 6 of 24 |
| 2026 | Sydney Roosters | 28 | 3.46 | 1,558 | 20.3 | 19 of 28 |
| 2026 | Parramatta Eels | 24 | 3.45 | 1,795 | 28.3 | 9 of 24 |
| 2026 | Newcastle Knights | 28 | 3.45 | 1,747 | 23.0 | 17 of 28 |
| 2026 | Canterbury Bulldogs | 24 | 3.42 | 1,575 | 22.3 | 11 of 24 |
| 2026 | Cronulla Sharks | 26 | 3.36 | 1,518 | 22.5 | 15 of 26 |
| 2026 | South Sydney Rabbitohs | 25 | 3.33 | 1,652 | 24.0 | 14 of 25 |
| 2025 | New Zealand Warriors | 25 | 3.69 | 1,614 | 20.8 | 14 of 25 |
| 2025 | Penrith Panthers | 27 | 3.64 | 1,611 | 19.2 | 15 of 27 |
| 2025 | Newcastle Knights | 24 | 3.61 | 1,855 | 26.6 | 6 of 24 |
| 2025 | Melbourne Storm | 27 | 3.58 | 1,570 | 19.1 | 19 of 27 |
| 2025 | Gold Coast Titans | 24 | 3.58 | 1,761 | 30.0 | 6 of 24 |
| 2025 | Wests Tigers | 24 | 3.58 | 1,679 | 25.5 | 9 of 24 |
| 2025 | Canberra Raiders | 26 | 3.54 | 1,648 | 21.8 | 19 of 26 |
| 2025 | Manly Sea Eagles | 24 | 3.53 | 1,603 | 22.3 | 12 of 24 |
| 2025 | Sydney Roosters | 25 | 3.52 | 1,567 | 21.6 | 13 of 25 |
| 2025 | South Sydney Rabbitohs | 24 | 3.52 | 1,842 | 25.3 | 9 of 24 |
| 2025 | North Queensland Cowboys | 24 | 3.51 | 1,761 | 28.5 | 9 of 24 |
| 2025 | St George Illawarra Dragons | 24 | 3.49 | 1,814 | 26.2 | 8 of 24 |
| 2025 | Dolphins | 24 | 3.48 | 1,645 | 24.8 | 12 of 24 |
| 2025 | Parramatta Eels | 24 | 3.48 | 1,725 | 24.1 | 10 of 24 |
| 2025 | Brisbane Broncos | 27 | 3.46 | 1,564 | 21.2 | 18 of 27 |
| 2025 | Canterbury Bulldogs | 26 | 3.44 | 1,455 | 18.7 | 16 of 26 |
| 2025 | Cronulla Sharks | 27 | 3.39 | 1,586 | 19.8 | 17 of 27 |
| 2024 | Melbourne Storm | 27 | 3.54 | 1,608 | 18.2 | 21 of 27 |
| 2024 | Canberra Raiders | 24 | 3.51 | 1,799 | 25.0 | 12 of 24 |
| 2024 | Manly Sea Eagles | 26 | 3.50 | 1,714 | 22.4 | 14 of 26 |
| 2024 | St George Illawarra Dragons | 24 | 3.50 | 1,766 | 26.4 | 11 of 24 |
| 2024 | Gold Coast Titans | 24 | 3.49 | 1,793 | 27.3 | 8 of 24 |
| 2024 | Sydney Roosters | 27 | 3.49 | 1,598 | 20.6 | 17 of 27 |
| 2024 | South Sydney Rabbitohs | 24 | 3.48 | 1,754 | 28.4 | 7 of 24 |
| 2024 | New Zealand Warriors | 24 | 3.47 | 1,594 | 23.9 | 9 of 24 |
| 2024 | Brisbane Broncos | 24 | 3.46 | 1,795 | 25.3 | 10 of 24 |
| 2024 | Newcastle Knights | 25 | 3.45 | 1,801 | 21.5 | 12 of 25 |
| 2024 | Penrith Panthers | 27 | 3.45 | 1,531 | 15.4 | 20 of 27 |
| 2024 | Wests Tigers | 24 | 3.45 | 1,761 | 31.3 | 6 of 24 |
| 2024 | North Queensland Cowboys | 26 | 3.43 | 1,638 | 23.5 | 16 of 26 |
| 2024 | Canterbury Bulldogs | 25 | 3.43 | 1,558 | 18.3 | 14 of 25 |
| 2024 | Parramatta Eels | 24 | 3.41 | 1,663 | 29.8 | 7 of 24 |
| 2024 | Dolphins | 24 | 3.33 | 1,745 | 24.1 | 11 of 24 |
| 2024 | Cronulla Sharks | 27 | 3.31 | 1,666 | 19.0 | 17 of 27 |
| 2023 | Gold Coast Titans | 24 | 3.69 | 1,761 | 27.2 | 9 of 24 |
| 2023 | Sydney Roosters | 26 | 3.66 | 1,661 | 20.2 | 14 of 26 |
| 2023 | Melbourne Storm | 27 | 3.65 | 1,597 | 19.9 | 17 of 27 |
| 2023 | St George Illawarra Dragons | 24 | 3.65 | 1,676 | 28.0 | 5 of 24 |
| 2023 | New Zealand Warriors | 27 | 3.63 | 1,618 | 19.7 | 17 of 27 |
| 2023 | Wests Tigers | 24 | 3.63 | 1,753 | 28.1 | 4 of 24 |
| 2023 | Canberra Raiders | 25 | 3.61 | 1,722 | 26.1 | 13 of 25 |
| 2023 | Brisbane Broncos | 27 | 3.57 | 1,681 | 17.1 | 20 of 27 |
| 2023 | Canterbury Bulldogs | 24 | 3.56 | 1,731 | 32.0 | 7 of 24 |
| 2023 | Manly Sea Eagles | 24 | 3.56 | 1,743 | 22.5 | 11 of 24 |
| 2023 | Cronulla Sharks | 25 | 3.54 | 1,635 | 20.4 | 14 of 25 |
| 2023 | South Sydney Rabbitohs | 24 | 3.52 | 1,652 | 21.0 | 12 of 24 |
| 2023 | Penrith Panthers | 27 | 3.50 | 1,503 | 12.8 | 21 of 27 |
| 2023 | Newcastle Knights | 26 | 3.49 | 1,729 | 20.0 | 15 of 26 |
| 2023 | North Queensland Cowboys | 24 | 3.47 | 1,765 | 22.6 | 12 of 24 |
| 2023 | Parramatta Eels | 24 | 3.45 | 1,684 | 23.9 | 12 of 24 |
| 2023 | Dolphins | 24 | 3.43 | 1,771 | 26.3 | 9 of 24 |
| 2022 | Manly Sea Eagles | 24 | 3.76 | 1,683 | 24.8 | 9 of 24 |
| 2022 | Wests Tigers | 24 | 3.74 | 1,725 | 28.3 | 4 of 24 |
| 2022 | Sydney Roosters | 25 | 3.73 | 1,536 | 18.6 | 15 of 25 |
| 2022 | New Zealand Warriors | 24 | 3.72 | 1,704 | 29.2 | 6 of 24 |
| 2022 | Gold Coast Titans | 24 | 3.67 | 1,753 | 27.5 | 6 of 24 |
| 2022 | Cronulla Sharks | 26 | 3.65 | 1,516 | 16.7 | 18 of 26 |
| 2022 | Penrith Panthers | 27 | 3.63 | 1,453 | 13.4 | 23 of 27 |
| 2022 | Melbourne Storm | 25 | 3.63 | 1,503 | 17.5 | 15 of 25 |
| 2022 | Canberra Raiders | 26 | 3.63 | 1,544 | 20.0 | 15 of 26 |
| 2022 | Canterbury Bulldogs | 24 | 3.58 | 1,675 | 24.0 | 7 of 24 |
| 2022 | St George Illawarra Dragons | 24 | 3.58 | 1,660 | 23.7 | 12 of 24 |
| 2022 | South Sydney Rabbitohs | 27 | 3.55 | 1,591 | 19.7 | 16 of 27 |
| 2022 | Newcastle Knights | 24 | 3.53 | 1,695 | 27.6 | 6 of 24 |
| 2022 | Parramatta Eels | 28 | 3.53 | 1,644 | 20.3 | 18 of 28 |
| 2022 | Brisbane Broncos | 24 | 3.51 | 1,722 | 22.9 | 13 of 24 |
| 2022 | North Queensland Cowboys | 26 | 3.48 | 1,530 | 16.0 | 18 of 26 |
| 2021 | St George Illawarra Dragons | 24 | 3.67 | 1,688 | 25.7 | 8 of 24 |
| 2021 | Wests Tigers | 24 | 3.66 | 1,669 | 29.8 | 8 of 24 |
| 2021 | Gold Coast Titans | 25 | 3.66 | 1,615 | 24.3 | 10 of 25 |
| 2021 | Canberra Raiders | 24 | 3.60 | 1,625 | 24.1 | 10 of 24 |
| 2021 | Melbourne Storm | 24 | 3.60 | 1,390 | 12.6 | 20 of 24 |
| 2021 | Penrith Panthers | 28 | 3.60 | 1,442 | 11.6 | 24 of 28 |
| 2021 | Canterbury Bulldogs | 24 | 3.59 | 1,837 | 29.5 | 3 of 24 |
| 2021 | New Zealand Warriors | 23 | 3.59 | 1,773 | 25.3 | 8 of 23 |
| 2021 | Manly Sea Eagles | 27 | 3.58 | 1,564 | 21.1 | 17 of 27 |
| 2021 | Newcastle Knights | 24 | 3.51 | 1,692 | 23.3 | 12 of 24 |
| 2021 | Brisbane Broncos | 24 | 3.50 | 1,816 | 29.0 | 7 of 24 |
| 2021 | South Sydney Rabbitohs | 27 | 3.49 | 1,415 | 18.3 | 22 of 27 |
| 2021 | Sydney Roosters | 26 | 3.48 | 1,600 | 21.3 | 17 of 26 |
| 2021 | Parramatta Eels | 25 | 3.43 | 1,575 | 19.2 | 15 of 25 |
| 2021 | North Queensland Cowboys | 23 | 3.42 | 1,742 | 31.7 | 7 of 23 |
| 2021 | Cronulla Sharks | 23 | 3.41 | 1,719 | 23.7 | 10 of 23 |
A flat cloud. Even the two ends:
| Six seasons | Club | Ruck allowed | Points let in a game | Won |
|---|---|---|---|---|
| Slowest ruck | Manly 2022 | 3.76s | 24.8 | 9 of 24 |
| Fastest ruck | Cronulla 2024 | 3.31s | 19.0 | 17 of 27 |
The slowest ruck let in more. Across all 100, slowing the ruck the most was worth less than one point a game.
The metre counter
Now flip Figure 2 to the metre counter: metres given up a game. The cloud climbs.
The 25 defences that gave up the fewest metres, a game, let in 18.0 points and won 67%. The 25 that gave up the most, , let in 27.1 and won 34%.
Nine points a game, and twice the wins.
Same ruck timing, opposite metres: in 2026 the Warriors gave up the fewest metres and the Dragons the most.
Same ruck timing, opposite metres: 1,513 v 1,901 metres a game
metres given up a game, 2026, finals included · shorter bar = better defence · ruck speed allowed beside each clubShow the numbers
| Club | Metres given up a game | Ruck speed allowed (s) | Points let in a game |
|---|---|---|---|
| New Zealand Warriors | 1,513 | 3.55 | 17.5 |
| Cronulla Sharks | 1,518 | 3.36 | 22.5 |
| Sydney Roosters | 1,558 | 3.46 | 20.3 |
| Canterbury Bulldogs | 1,575 | 3.42 | 22.3 |
| Penrith Panthers | 1,578 | 3.51 | 14.7 |
| Manly Sea Eagles | 1,608 | 3.48 | 21.8 |
| Melbourne Storm | 1,650 | 3.53 | 24.0 |
| South Sydney Rabbitohs | 1,652 | 3.33 | 24.0 |
| Dolphins | 1,666 | 3.49 | 21.5 |
| Canberra Raiders | 1,713 | 3.53 | 26.1 |
| Wests Tigers | 1,733 | 3.54 | 29.1 |
| Newcastle Knights | 1,747 | 3.45 | 23.0 |
| North Queensland Cowboys | 1,771 | 3.54 | 27.1 |
| Parramatta Eels | 1,795 | 3.45 | 28.3 |
| Brisbane Broncos | 1,813 | 3.49 | 28.2 |
| Gold Coast Titans | 1,844 | 3.47 | 27.6 |
| St George Illawarra Dragons | 1,901 | 3.53 | 29.9 |
Side by side, ruck timing and the metre counter:
Sorted by ruck timing: 0.9 points. Sorted by metres: 9.2
points let in a game · the 25 club-seasons at each end of 100, 2021 to 2026, finals includedSorted by ruck timing
Slowed the ruck most 3.66s
22.4won 48%Slowed it least 3.42s
23.3won 50%0.9 points apart
Sorted by the metre counter
Fewest metres given up 1,525 a game · ruck 3.52s
18.0won 67%Most metres given up 1,794 a game · ruck 3.52s
27.1won 34%9.2 points apart
Show the numbers
| Quarter | Club-seasons | Ruck speed allowed (s) | Metres given up a game | Points let in a game | Won |
|---|---|---|---|---|---|
| Slowed the ruck most | 25 | 3.66 | 1,629 | 22.4 | 48% |
| Slowed the ruck least | 25 | 3.42 | 1,668 | 23.3 | 50% |
| Fewest metres given up | 25 | 3.52 | 1,525 | 18.0 | 67% |
| Most metres given up | 25 | 3.52 | 1,794 | 27.1 | 34% |
Who makes those metres? Phillip Sami ran metres in 2026, the most in the NRL. The longest carry counts every runner.
Six again from the 20
Then 2026 moved the line where a ruck mistake becomes a six-again.
Six again from the 20, not the 40: 5.9 a game became 9.8
where a ruck infringement by the defence is a six-again rather than a penalty · six-agains a game2025 six again outside your own 40
2026 six again outside your own 20
5.9 six-agains a game, 20259.8 opening rounds of 2026
Show the numbers
| Season | Six again outside your own | Six-agains a game |
|---|---|---|
| 2025 | 40 metres | 5.9 |
| 2026 (opening rounds) | 20 metres | 9.8 |
Every six-again is another set to make metres against you, with no breather.
Wrong question?
So, faster or slower? Faster, but stop watching the clock.
The myth
- Get off the line
- Slow their ruck
- Win the game?
What the numbers say
- Get off the line
- Meet them early
- Fewer metres
- Fewer points
It's not how fast you get there. It's where you meet them.
What this can't see: real line speed, which is club GPS data, or where on the field each tackle happened. That's why every number here is a whole season.
Summary
- Points let in, by ruck timing
- 22.4slowed the ruck most23.3slowed it least
- Points let in, by the metres
- 18.0fewest metres27.1most metres
- Warriors v Dragons, 2026
- 3.55s · 17.5Warriors: ruck, let in3.53s · 29.9Dragons: ruck, let in
The working
Definitions, sources and when the numbers were read
- Games
- Every complete NRL game, 2021 to 2026, finals included: 1,254. 7 of the 2,508 club-games have no play-the-ball times and are left out, not counted as zero. A season is the calendar year.
- Ruck speed allowed
- For one club in one game: the average play-the-ball time of the opposing players who have one recorded (a zero means none recorded and is left out). A club's season is the average over its games. It stands in for line speed; it is not line speed, which only the clubs' GPS and tracking data measure.
- Metres given up
- The opposing team's run metres in the game, every player added together, averaged over the club's games.
- Points let in
- Points conceded a game, from the final scores.
- Club-seasons and quarters
- 100 club-seasons: 16 clubs in 2021 and 2022, 17 from 2023. A quarter is the 25 at one end, sorted by ruck speed allowed or by metres given up; its numbers are the plain average of those 25 seasons. Won counts wins only; a draw is not a win. The averages in Figure 2 are over all 100 club-seasons; Figure 3's is over the 17 clubs of 2026.
- How strong the links are
- Across the 100 club-seasons (Pearson correlation): ruck speed allowed against points let in, r = 0.02; metres given up against points let in, r = 0.79; ruck speed allowed against win %, r = -0.14; ruck speed allowed against metres given up, r = -0.06. Game by game within each season, ruck speed allowed against points let in ran from 0.01 to 0.18, and against metres given up from -0.03 to 0.17.
- Field position
- A team attacking near the try line plays the ball slower and scores more, which muddies single games. Whole seasons wash most of that out, which is why every headline number here is a season average.
- 2026
- Finals included: the Warriors' 26 games include 2 finals; the Dragons played 24. Phillip Sami (Gold Coast Titans): 5,384 run metres in 24 games.
- Sources
- The NRL's own record is at nrl.com/draw. The 2026 rule (“for certain infringements beyond the 20-metre line, the tackle count will restart, replacing the current 40-metre threshold”) is from the ARLC's announcement, 4 February 2026. The six-again counts (5.9 a game in 2025, 9.8 in the opening rounds of 2026) are from AAP (aapnews.aap.com.au). Bryan Fletcher on the Warriors is from SEN, 25 May 2026 (sen.com.au).
- Read
- 16 October 2026, from Punt's database.
- Not in this article
- True line speed (club GPS and tracking data), where on the field each tackle was made, penalties and six-agains by club, and prices.
- Sources and terms
- Every source Punt uses, with its licence, is on Credits. The terms are defined in the Glossary, and the methodology page sets out where every number comes from and the rules it follows.