
Give away 4+ more penalties and you still win 41%
win rate, by penalties given away compared with the other team · NRL regular seasons 2021–26 · each game counted from both sidesa coin flip
Show the numbers
| Penalties given away, compared with the other team | Won | Team-games | Win rate |
|---|---|---|---|
| 4+ fewer | 169 | 285 | 59.3% |
| 1 to 3 fewer | 410 | 739 | 55.5% |
| Level | 173 | 346 | 50.0% |
| 1 to 3 more | 329 | 739 | 44.5% |
| 4+ more | 116 | 285 | 40.7% |
Why?
Every NRL coach has said it after a loss: our discipline let us down. It's the safest line at a post-match press conference. So I counted every penalty in every NRL regular-season game since 2021, 1,197 games with a winner. It's the second coach's line we've checked, after line speed.

The cue card. The excuse.
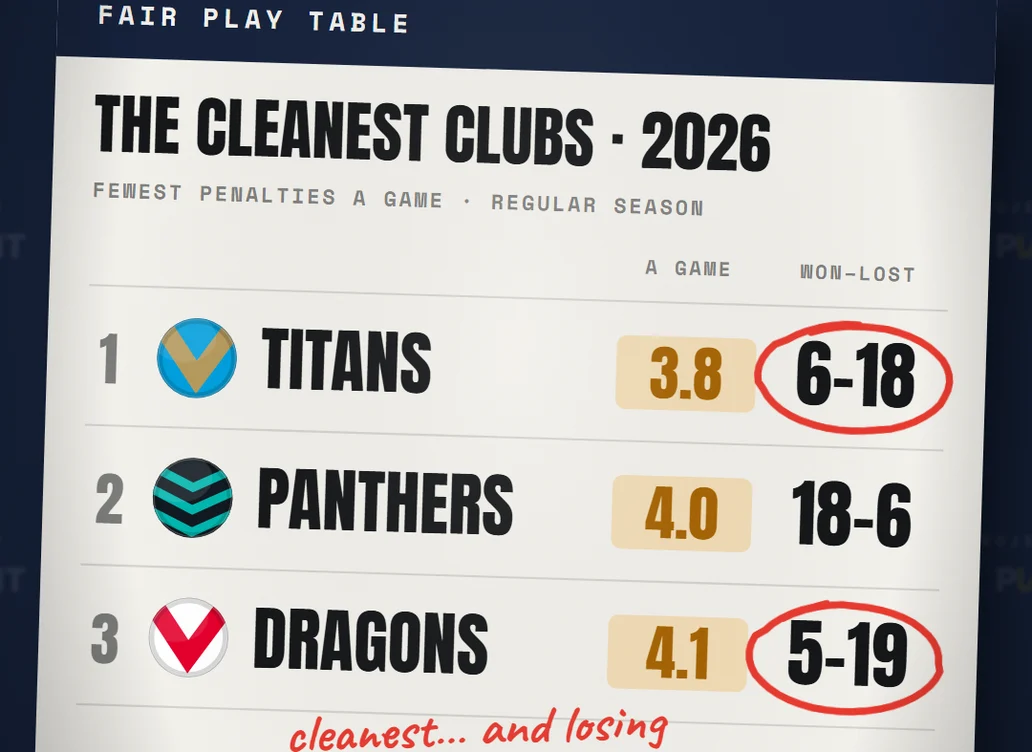
2026's cleanest clubs. Titans 6–18, Dragons 5–19.
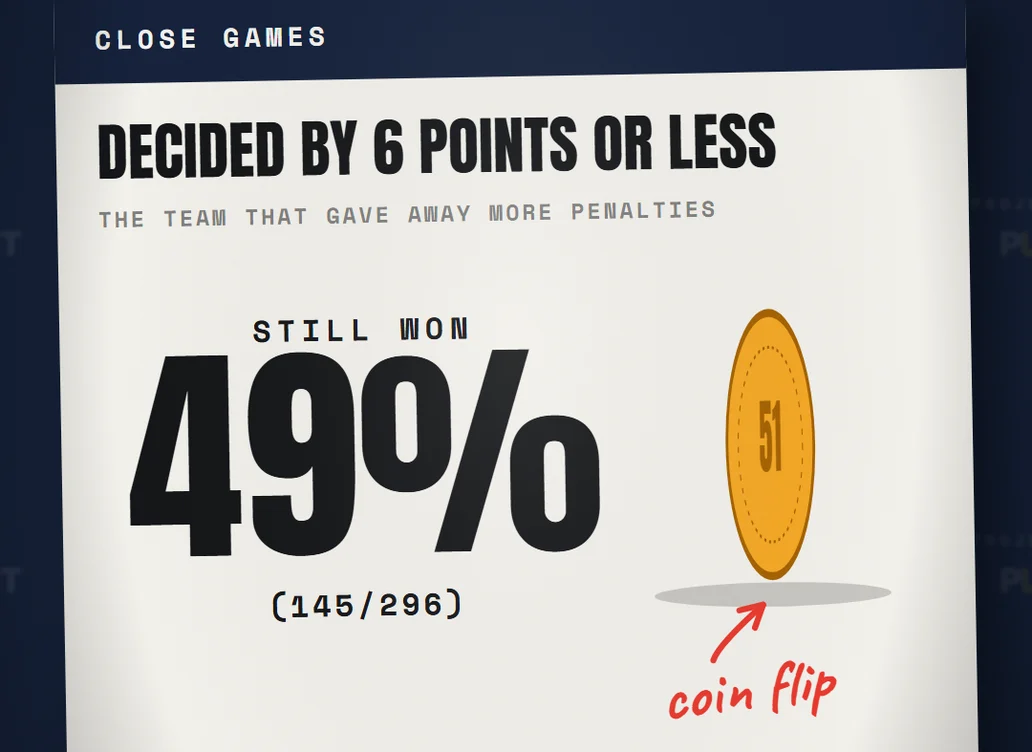
Close games. A coin flip.
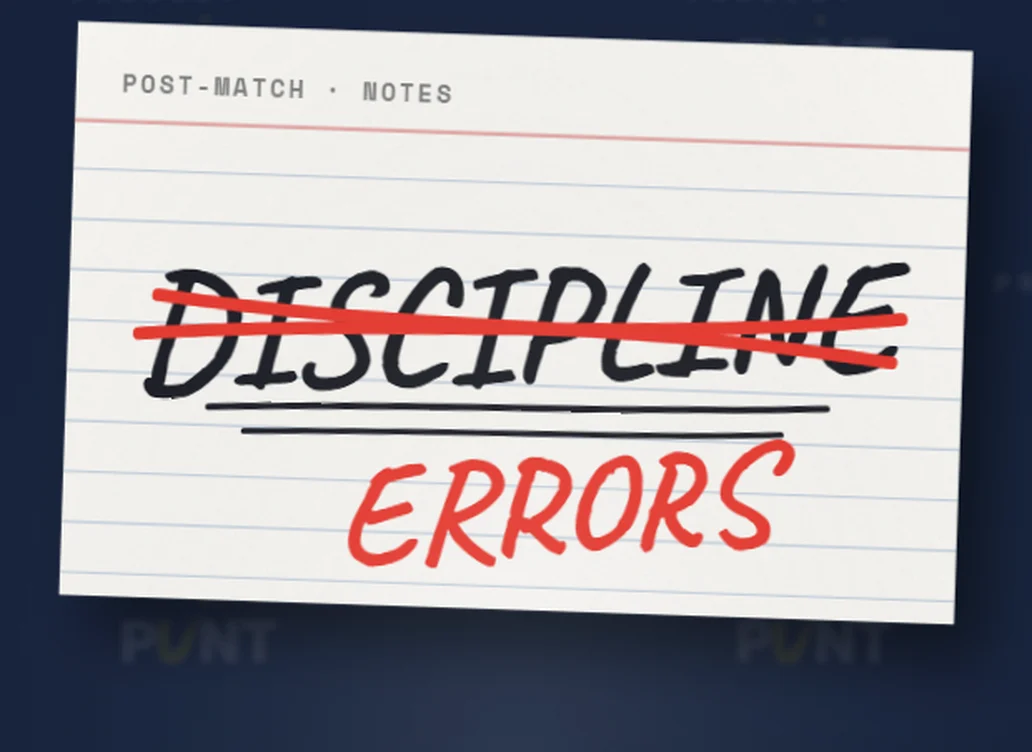
The rewrite. Errors, not discipline.
Four more, and still winning
Give away 4 or more penalties than the other team and you still win 41% of the time (116/285). Give away 4 or more fewer and it's 59%. Level: 50%.
The team that gives away more penalties, by any number, wins 43.5% (445/1024). Winners average 5.1 penalties a game; losers 5.4. A penalty count tilts a game. It doesn't decide it. Even the team with more sin bins wins 42.9% (164/382).
A coin flip when it's close
The excuse comes out most after a close loss, so here are the close ones. 345 games were decided by 6 points or less. In 296 of them one side gave away more penalties, and that side won 145:
Close games: the more-penalised side won 145 of 296
NRL regular seasons 2021–26 · games decided by 6 points or less · one coin a game, in date order145 won anyway
151 lost
Show the numbers
| Games | |
|---|---|
| More-penalised side won | 145 |
| More-penalised side lost | 151 |
49%. A coin flip. In 2025 it was 50.3% across every game, close or not.
The cleanest clubs
Here is every club's 2026 penalty count, fewest first, with its record.
Every NRL club's penalty count in 2026, and its record
penalties given away a game · 2026 regular season · fewest first · won–lost beside each clubShow the numbers
| Club | Penalties a game | Errors a game | Won–lost |
|---|---|---|---|
| Gold Coast Titans | 3.8 | 11.8 | 6–18 |
| Penrith Panthers | 4.0 | 11.1 | 18–6 |
| St George Illawarra Dragons | 4.1 | 11.8 | 5–19 |
| Parramatta Eels | 4.2 | 12.5 | 9–15 |
| New Zealand Warriors | 4.3 | 10.4 | 18–6 |
| Melbourne Storm | 4.3 | 10.5 | 11–13 |
| Wests Tigers | 4.6 | 11.2 | 8–16 |
| Manly Sea Eagles | 4.7 | 11.6 | 11–13 |
| South Sydney Rabbitohs | 4.8 | 10.6 | 14–10 |
| Newcastle Knights | 4.8 | 11.6 | 14–10 |
| Dolphins | 5.0 | 12.1 | 17–7 |
| Canberra Raiders | 5.0 | 10.4 | 11–13 |
| Canterbury Bulldogs | 5.0 | 11.8 | 11–13 |
| Sydney Roosters | 5.3 | 12.5 | 16–8 |
| Cronulla Sharks | 5.3 | 10.9 | 14–10 |
| North Queensland Cowboys | 5.6 | 11.8 | 13–11 |
| Brisbane Broncos | 5.8 | 11.5 | 8–16 |
The Titans gave away the fewest, 3.8 a game, and won 6 of 24. The Dragons were third-cleanest at 4.1 and won 5. In between, Penrith (4.0) went 18–6, and the Warriors (4.3) went 18–6. Clean clubs won and lost. The penalty count didn't sort them.
It runs the other way too. Of the 8 most penalised club-seasons since 2021, 7 were winning seasons.
| Season | Club | Penalties a game | Won–lost |
|---|---|---|---|
| 2024 | Roosters | 7.3 | 16–8 |
| 2022 | Storm | 7.0 | 15–9 |
| 2023 | Roosters | 6.5 | 13–11 |
| 2025 | Broncos | 6.4 | 15–9 |
| 2025 | Bulldogs | 6.4 | 16–8 |
| 2022 | Roosters | 6.4 | 15–9 |
| 2024 | Sharks | 6.3 | 16–8 |
| 2023 | Bulldogs | 6.3 | 7–17 |
The most penalised of all 100, the 2024 Roosters at 7.3 a game, went 16–8. In 2025 the Dolphins beat the Dragons 56–6 while giving away 7 penalties to 2.
Blame the errors
So if a coach wants something to blame, try the errors. Same test, 4 or more than the other team:
4+ more penalties: 41% won. 4+ more errors: 28%
win rate when a side had 4 or more than the other team · NRL regular seasons 2021–26 · each game counted from both sidesShow the numbers
| 4 or more than the other team | Won | Team-games | Win rate |
|---|---|---|---|
| Penalties | 116 | 285 | 40.7% |
| Errors | 130 | 458 | 28.4% |
Make 4 or more errors than the other team and you win 28% (130/458). Errors cost more than penalties.
If you don't watch much league, a penalty is like a foul in basketball and an error is like a turnover.
- A penalty: offside, a high tackle, lying on the tackled player to slow the ruck. The other team gets the ball, then kicks for touch and keeps it, or kicks at goal for 2.
- An error: a knock-on, a forward pass, a kick out on the full. The other team gets the ball at a scrum.
On paper the penalty should hurt more. It hands over the same ball, plus ground or a shot at goal. The scoreboard says the opposite:
| Each extra one, against the other team | Moves the final margin by |
|---|---|
| Penalty | 0.75 points |
| Error | 1.42 points |
They aren't the same thing in disguise either. Sides that gave away 7 or more penalties made 10.5 errors a game; sides with 3 or fewer made 11.0.
The numbers show that errors hurt more, not why. One likely part: an error nearly always hands over a ball you had, and plenty of penalties come when the other team already has it. Some are given away on purpose, to slow a raid down.
So what do you blame?
Penalties cost you a little. Errors cost you the game.
What these numbers can't count is the six-again. A ruck infringement now usually restarts the tackle count instead of costing a penalty, and the feed doesn't record restarts. Next I'd like to count those, game by game, to see whether the real discipline story is hiding there.
Summary
- 4+ more penalties
- 41%won (116/285)
- Close games, more penalties
- 49%won (145/296)
- 4+ more errors
- 28%won (130/458)
The working
Definitions, sources and when the numbers were read
- Games
- Every complete NRL regular-season game, 2021 to 2026, with a winner: 1,197 (3 draws left out). Finals left out. Each game counts twice, once from each side.
- Penalties, errors, sin bins
- A side's count is the sum of its players' counts in that game, as nrl.com credits them. Checked against nrl.com's team totals in three games (Dolphins v Dragons, round 14 2025; Titans v Sharks, round 23 2024; Storm v Rabbitohs, round 8 2026): all six penalty counts exact.
- Close game
- Decided by 6 points or less: 345 games. Figure 2 leaves out the ones with level penalties.
- Points per extra
- Derived: the least-squares slope of the final margin on the penalty (or error) difference, across every team-game. Penalty -0.75, error -1.42 points.
- By season
- The side with more penalties won: 2021 35.3%, 2022 42.9%, 2023 39.3%, 2024 46.9%, 2025 50.3%, 2026 46.0%.
- Other counts
- More errors, by any number: 36.8% won (393/1068). Penalties a game, everyone: 5.2; errors a game: 10.8.
- Read
- 23 October 2026, from Punt's database.
- Sources
- NRL results and match stats: nrl.com/draw.
- Not in this article
- Six-agains (set restarts), which the feed doesn't record; who the referee was; penalty goals as points; finals; and any game still to be played. No result is predicted here.
- Sources and terms
- Every source Punt uses, with its licence, is on Credits. The terms are defined in the Glossary, and the methodology page sets out where every number comes from and the rules it follows.