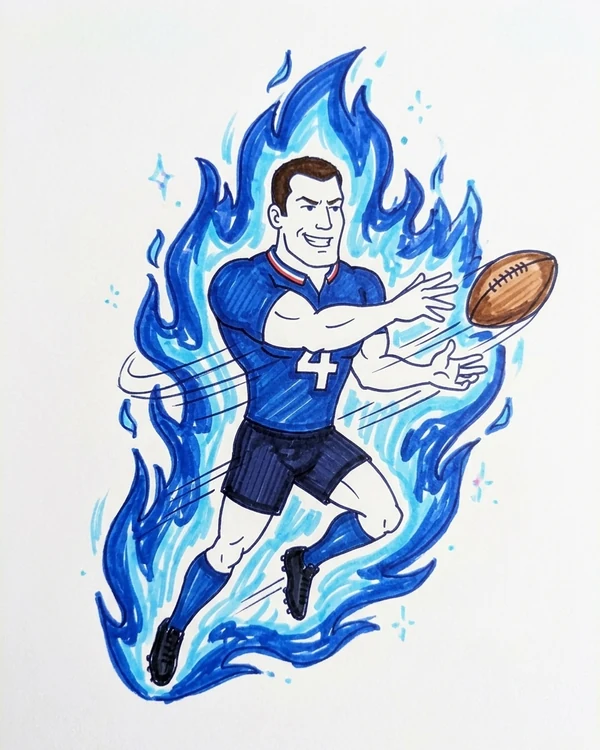
Impact per 100 touches, every NRL player of 2026
314 players · 10+ games and 150+ touches · regular seasonShow the numbers
| Rank | Player | Club | Position | Games | Touches | Tries | Try assists | Line breaks | Line-break assists | Per 100 touches |
|---|---|---|---|---|---|---|---|---|---|---|
| 1 | Alex Johnston | SOU | Winger | 21 | 392 | 30 | 7 | 41 | 4 | 20.9 |
| 2 | Latrell Mitchell | SOU | Centre | 11 | 272 | 12 | 9 | 11 | 19 | 18.8 |
| 3 | Bradman Best | NEW | Centre | 14 | 227 | 4 | 15 | 4 | 16 | 17.2 |
| 4 | Casey McLean | PEN | Centre | 18 | 318 | 11 | 10 | 12 | 16 | 15.4 |
| 5 | Robert Toia | SYD | Centre | 20 | 310 | 12 | 12 | 14 | 9 | 15.2 |
| 6 | Dominic Young | NEW | Winger | 23 | 415 | 20 | 5 | 36 | 1 | 14.9 |
| 7 | Alofiana Khan-Pereira | WAR | Winger | 17 | 264 | 16 | 2 | 18 | 3 | 14.8 |
| 8 | Ali Leiataua | WAR | Centre | 20 | 254 | 6 | 7 | 8 | 12 | 13.0 |
| 9 | Tolutau Koula | MAN | Centre | 19 | 349 | 9 | 9 | 16 | 11 | 12.9 |
| 10 | Tallis Duncan | SOU | 2nd row | 21 | 365 | 12 | 8 | 16 | 10 | 12.6 |
| 11 | Thomas Jenkins | PEN | Winger | 24 | 574 | 30 | 7 | 35 | 0 | 12.5 |
| 12 | Clayton Faulalo | MAN | Fullback | 14 | 339 | 8 | 11 | 8 | 15 | 12.4 |
| 13 | Simi Sasagi | CBR | Centre | 16 | 316 | 7 | 11 | 10 | 11 | 12.3 |
| 14 | Arama Hau | GLD | 2nd row | 21 | 155 | 7 | 0 | 9 | 3 | 12.3 |
| 15 | Fletcher Hunt | NEW | Bench | 18 | 297 | 13 | 5 | 12 | 6 | 12.1 |
| 16 | Greg Marzhew | NEW | Winger | 23 | 452 | 24 | 0 | 26 | 3 | 11.7 |
| 17 | Moses Leo | MEL | Winger | 17 | 242 | 11 | 1 | 16 | 0 | 11.6 |
| 18 | Billy Smith | SYD | Winger | 14 | 324 | 12 | 5 | 16 | 3 | 11.1 |
| 19 | Valentine Holmes | SGI | Centre | 24 | 404 | 10 | 8 | 16 | 10 | 10.9 |
| 20 | Selwyn Cobbo | DOL | Winger | 18 | 409 | 17 | 3 | 23 | 1 | 10.8 |
| 21 | Tom Trbojevic | MAN | Fullback | 14 | 400 | 8 | 12 | 11 | 12 | 10.8 |
| 22 | Dallin Watene-Zelezniak | WAR | Winger | 21 | 382 | 20 | 1 | 19 | 1 | 10.7 |
| 23 | Ronaldo Mulitalo | CRO | Winger | 15 | 295 | 12 | 3 | 15 | 1 | 10.5 |
| 24 | Sualauvi Faalogo | MEL | Fullback | 24 | 777 | 18 | 15 | 23 | 24 | 10.3 |
| 25 | Patrick Herbert | WST | Centre | 13 | 177 | 1 | 7 | 3 | 7 | 10.2 |
| 26 | Adam Pompey | WAR | Centre | 16 | 258 | 5 | 6 | 5 | 10 | 10.1 |
| 27 | Herbie Farnworth | DOL | Centre | 23 | 501 | 13 | 7 | 13 | 17 | 10.0 |
| 28 | Jacob Preston | CBY | 2nd row | 20 | 281 | 7 | 4 | 14 | 3 | 10.0 |
| 29 | Jake Averillo | DOL | Centre | 10 | 221 | 6 | 5 | 7 | 4 | 9.9 |
| 30 | Mark Nawaqanitawase | SYD | Winger | 19 | 422 | 15 | 6 | 16 | 5 | 9.9 |
| 31 | Jack Bostock | DOL | Centre | 14 | 314 | 5 | 11 | 5 | 10 | 9.9 |
| 32 | Daniel Tupou | SYD | Winger | 14 | 260 | 13 | 2 | 10 | 0 | 9.6 |
| 33 | Dane Gagai | NEW | Centre | 22 | 442 | 5 | 10 | 9 | 18 | 9.5 |
| 34 | Dylan Lucas | NEW | 2nd row | 16 | 211 | 10 | 1 | 9 | 0 | 9.5 |
| 35 | Sione Katoa | CRO | Winger | 18 | 380 | 16 | 0 | 19 | 1 | 9.5 |
| 36 | Lehi Hopoate | MAN | Winger | 23 | 548 | 19 | 4 | 23 | 5 | 9.3 |
| 37 | Liam Martin | PEN | 2nd row | 16 | 208 | 7 | 2 | 7 | 3 | 9.1 |
| 38 | Heilum Luki | NQL | 2nd row | 24 | 286 | 11 | 1 | 14 | 0 | 9.1 |
| 39 | Braidon Burns | NQL | Winger | 20 | 441 | 15 | 2 | 19 | 4 | 9.1 |
| 40 | Hugo Savala | SYD | Centre | 19 | 387 | 8 | 10 | 6 | 11 | 9.0 |
| 41 | Moses Suli | SGI | Centre | 15 | 212 | 4 | 5 | 2 | 8 | 9.0 |
| 42 | Charnze Nicoll-Klokstad | WAR | Fullback | 14 | 327 | 12 | 2 | 13 | 2 | 8.9 |
| 43 | Campbell Graham | SOU | Winger | 18 | 361 | 13 | 1 | 15 | 3 | 8.9 |
| 44 | Matthew Dufty | SOU | Fullback | 14 | 400 | 3 | 7 | 12 | 13 | 8.8 |
| 45 | Haumole Olakau'atu | MAN | 2nd row | 21 | 425 | 9 | 6 | 13 | 9 | 8.7 |
| 46 | Samuela Fainu | WST | 2nd row | 16 | 210 | 4 | 4 | 5 | 5 | 8.6 |
| 47 | Cody Ramsey | SYD | Bench | 12 | 294 | 2 | 7 | 10 | 6 | 8.5 |
| 48 | Tyrell Sloan | SGI | Winger | 18 | 353 | 12 | 2 | 14 | 2 | 8.5 |
| 49 | Jamayne Isaako | DOL | Winger | 24 | 547 | 21 | 2 | 22 | 1 | 8.4 |
| 50 | Tom Chester | NQL | Centre | 23 | 445 | 11 | 2 | 20 | 4 | 8.3 |
| 51 | Jojo Fifita | GLD | Centre | 20 | 317 | 8 | 4 | 11 | 3 | 8.2 |
| 52 | Izack Tago | PEN | Centre | 15 | 184 | 3 | 3 | 4 | 5 | 8.2 |
| 53 | Will Warbrick | MEL | Winger | 18 | 356 | 16 | 2 | 11 | 0 | 8.2 |
| 54 | James Tedesco | SYD | Fullback | 17 | 605 | 11 | 14 | 15 | 9 | 8.1 |
| 55 | Leka Halasima | WAR | 2nd row | 20 | 235 | 8 | 2 | 7 | 2 | 8.1 |
| 56 | William Kennedy | CRO | Fullback | 24 | 656 | 10 | 16 | 11 | 16 | 8.1 |
| 57 | Jacob Laban | WAR | 2nd row | 23 | 274 | 8 | 3 | 10 | 1 | 8.0 |
| 58 | Kalyn Ponga | NEW | Fullback | 15 | 611 | 5 | 14 | 10 | 20 | 8.0 |
| 59 | Josh Curran | CBY | Bench | 16 | 151 | 6 | 1 | 4 | 1 | 8.0 |
| 60 | Roger Tuivasa-Sheck | WAR | Winger | 10 | 204 | 2 | 5 | 5 | 4 | 7.8 |
| 61 | Reuben Garrick | MAN | Centre | 23 | 436 | 11 | 4 | 11 | 8 | 7.8 |
| 62 | Jason Saab | MAN | Winger | 23 | 463 | 15 | 4 | 15 | 2 | 7.8 |
| 63 | Ben Trbojevic | MAN | 2nd row | 21 | 336 | 5 | 4 | 9 | 8 | 7.7 |
| 64 | Brian To'o | PEN | Winger | 22 | 492 | 15 | 0 | 22 | 1 | 7.7 |
| 65 | Murray Taulagi | NQL | Winger | 17 | 353 | 11 | 1 | 10 | 5 | 7.7 |
| 66 | Connelly Lemuelu | DOL | 2nd row | 22 | 302 | 6 | 4 | 9 | 4 | 7.6 |
| 67 | Will Penisini | PAR | Centre | 12 | 198 | 4 | 1 | 6 | 4 | 7.6 |
| 68 | Jesse Ramien | CRO | Centre | 14 | 225 | 6 | 2 | 8 | 1 | 7.6 |
| 69 | Jethro Rinakama | CBY | Winger | 10 | 227 | 7 | 0 | 10 | 0 | 7.5 |
| 70 | KL Iro | CRO | Centre | 21 | 365 | 12 | 2 | 10 | 3 | 7.4 |
| 71 | Sean Russell | PAR | Centre | 18 | 246 | 4 | 5 | 4 | 5 | 7.3 |
| 72 | Kotoni Staggs | BRI | Centre | 21 | 331 | 9 | 2 | 7 | 6 | 7.3 |
| 73 | Kelma Tuilagi | PAR | 2nd row | 17 | 207 | 5 | 1 | 6 | 3 | 7.3 |
| 74 | Bronson Xerri | CBY | Centre | 16 | 236 | 3 | 5 | 4 | 5 | 7.2 |
| 75 | Sitili Tupouniua | CBY | Bench | 15 | 195 | 4 | 2 | 3 | 5 | 7.2 |
| 76 | Nicholas Hynes | CRO | Halfback | 20 | 937 | 7 | 23 | 12 | 25 | 7.2 |
| 77 | Xavier Savage | CBR | Winger | 19 | 338 | 13 | 1 | 10 | 0 | 7.1 |
| 78 | Jack Howarth | MEL | Centre | 17 | 273 | 6 | 3 | 5 | 5 | 7.0 |
| 79 | Paul Alamoti | PEN | Centre | 21 | 345 | 4 | 4 | 9 | 7 | 7.0 |
| 80 | Jaxon Purdue | NQL | Centre | 24 | 672 | 9 | 11 | 15 | 11 | 6.8 |
| 81 | Grant Anderson | BRI | Winger | 12 | 237 | 4 | 2 | 5 | 5 | 6.8 |
| 82 | Hamiso Tabuai-Fidow | DOL | Fullback | 19 | 713 | 13 | 10 | 11 | 14 | 6.7 |
| 83 | Isaiah Iongi | PAR | Fullback | 13 | 389 | 5 | 6 | 7 | 8 | 6.7 |
| 84 | Jesse Arthars | BRI | Winger | 10 | 166 | 5 | 1 | 5 | 0 | 6.6 |
| 85 | Ezra Mam | BRI | Five-eighth | 22 | 705 | 10 | 12 | 13 | 11 | 6.5 |
| 86 | Enari Tuala | CBY | Centre | 19 | 370 | 5 | 2 | 14 | 3 | 6.5 |
| 87 | Kaeo Weekes | CBR | Fullback | 24 | 721 | 14 | 7 | 13 | 12 | 6.4 |
| 88 | Jordan Samrani | PAR | Centre | 15 | 267 | 8 | 1 | 8 | 0 | 6.4 |
| 89 | Kodi Nikorima | DOL | Five-eighth | 20 | 760 | 4 | 16 | 5 | 23 | 6.3 |
| 90 | Matthew Timoko | CBR | Centre | 19 | 333 | 6 | 2 | 9 | 4 | 6.3 |
| 91 | Josh Addo-Carr | PAR | Winger | 23 | 381 | 8 | 1 | 15 | 0 | 6.3 |
| 92 | Jye Gray | SOU | Fullback | 15 | 398 | 4 | 6 | 9 | 6 | 6.3 |
| 93 | David Fifita | SOU | 2nd row | 16 | 287 | 6 | 2 | 7 | 3 | 6.3 |
| 94 | Setu Tu | SGI | Winger | 19 | 436 | 10 | 3 | 13 | 1 | 6.2 |
| 95 | Te Maire Martin | WAR | Halfback | 11 | 599 | 6 | 12 | 7 | 12 | 6.2 |
| 96 | Cody Walker | SOU | Five-eighth | 23 | 1183 | 9 | 26 | 11 | 27 | 6.2 |
| 97 | Braydon Trindall | CRO | Five-eighth | 21 | 1070 | 9 | 30 | 6 | 21 | 6.2 |
| 98 | Sebastian Kris | CBR | Centre | 15 | 244 | 4 | 0 | 7 | 4 | 6.2 |
| 99 | Josiah Karapani | BRI | Winger | 22 | 472 | 8 | 1 | 20 | 0 | 6.1 |
| 100 | Siale Faeamani | GLD | Winger | 10 | 182 | 5 | 1 | 4 | 1 | 6.0 |
| 101 | Mathew Feagai | SGI | Winger | 18 | 252 | 5 | 0 | 9 | 1 | 6.0 |
| 102 | Jack Wighton | SOU | Centre | 18 | 303 | 4 | 5 | 3 | 6 | 5.9 |
| 102 | Siosifa Talakai | CRO | Bench | 21 | 202 | 5 | 1 | 3 | 3 | 5.9 |
| 104 | Scott Drinkwater | NQL | Fullback | 24 | 1184 | 10 | 23 | 8 | 29 | 5.9 |
| 104 | Stephen Crichton | CBY | Centre | 20 | 592 | 7 | 9 | 8 | 11 | 5.9 |
| 106 | Adam Doueihi | WST | Halfback | 14 | 663 | 8 | 9 | 9 | 13 | 5.9 |
| 106 | Jeral Skelton | WST | Winger | 13 | 255 | 8 | 0 | 7 | 0 | 5.9 |
| 108 | Kurtis Morrin | GLD | Bench | 22 | 290 | 7 | 2 | 6 | 2 | 5.9 |
| 109 | Ethan Strange | CBR | Five-eighth | 21 | 632 | 7 | 10 | 10 | 10 | 5.8 |
| 110 | Jahrome Hughes | MEL | Halfback | 18 | 910 | 3 | 23 | 6 | 21 | 5.8 |
| 111 | Hamish Stewart | SGI | 2nd row | 24 | 449 | 5 | 9 | 5 | 7 | 5.8 |
| 112 | Luke Garner | PEN | 2nd row | 17 | 156 | 3 | 1 | 4 | 1 | 5.8 |
| 113 | Hudson Young | CBR | 2nd row | 14 | 316 | 5 | 6 | 4 | 3 | 5.7 |
| 114 | Joe Chan | MEL | 2nd row | 18 | 194 | 2 | 1 | 6 | 2 | 5.7 |
| 115 | Tom Dearden | NQL | Halfback | 13 | 711 | 2 | 14 | 6 | 18 | 5.6 |
| 116 | Viliame Kikau | CBY | 2nd row | 15 | 198 | 2 | 2 | 5 | 2 | 5.6 |
| 117 | Reece Walsh | BRI | Fullback | 16 | 721 | 6 | 11 | 7 | 16 | 5.5 |
| 118 | Nick Meaney | MEL | Centre | 20 | 325 | 5 | 3 | 8 | 2 | 5.5 |
| 119 | Deine Mariner | BRI | Winger | 18 | 273 | 4 | 3 | 7 | 1 | 5.5 |
| 120 | Brian Kelly | PAR | Winger | 22 | 513 | 5 | 8 | 9 | 6 | 5.5 |
| 121 | Fletcher Sharpe | NEW | Five-eighth | 22 | 899 | 12 | 11 | 11 | 15 | 5.5 |
| 122 | Sunia Turuva | WST | Winger | 21 | 390 | 5 | 2 | 13 | 1 | 5.4 |
| 123 | Teig Wilton | CRO | 2nd row | 21 | 279 | 8 | 0 | 7 | 0 | 5.4 |
| 124 | Savelio Tamale | CBR | Winger | 15 | 317 | 7 | 1 | 8 | 1 | 5.4 |
| 125 | Billy Burns | CRO | Bench | 24 | 299 | 6 | 2 | 7 | 1 | 5.3 |
| 126 | Nathan Cleary | PEN | Halfback | 21 | 1331 | 6 | 27 | 14 | 24 | 5.3 |
| 127 | Cameron Murray | SOU | Lock | 19 | 435 | 5 | 5 | 7 | 6 | 5.3 |
| 128 | Jake Clifford | NQL | Five-eighth | 23 | 877 | 9 | 14 | 11 | 12 | 5.3 |
| 129 | Beau Fermor | GLD | 2nd row | 23 | 364 | 4 | 1 | 6 | 8 | 5.2 |
| 130 | AJ Brimson | GLD | Centre | 22 | 503 | 6 | 6 | 8 | 6 | 5.2 |
| 131 | Jacob Kiraz | CBY | Winger | 20 | 489 | 9 | 2 | 9 | 5 | 5.1 |
| 132 | Dylan Edwards | PEN | Fullback | 21 | 901 | 11 | 10 | 8 | 17 | 5.1 |
| 133 | Zac Laybutt | NQL | Centre | 19 | 295 | 2 | 2 | 6 | 5 | 5.1 |
| 134 | Jahream Bula | WST | Fullback | 21 | 672 | 6 | 9 | 6 | 13 | 5.1 |
| 135 | Kitione Kautoga | PAR | 2nd row | 19 | 258 | 2 | 3 | 4 | 4 | 5.0 |
| 136 | Phillip Sami | GLD | Winger | 24 | 622 | 15 | 1 | 14 | 1 | 5.0 |
| 137 | Liam Henry | PEN | Bench | 15 | 222 | 4 | 1 | 6 | 0 | 5.0 |
| 138 | Briton Nikora | CRO | 2nd row | 19 | 224 | 3 | 1 | 4 | 3 | 4.9 |
| 139 | Jed Stuart | CBR | Winger | 17 | 287 | 6 | 2 | 5 | 1 | 4.9 |
| 139 | Kurt Capewell | WAR | 2nd row | 13 | 164 | 2 | 2 | 3 | 1 | 4.9 |
| 141 | Matt Burton | CBY | Five-eighth | 23 | 823 | 9 | 7 | 11 | 13 | 4.9 |
| 142 | Daine Laurie | CBR | Bench | 15 | 312 | 4 | 3 | 6 | 2 | 4.8 |
| 143 | Jayden Campbell | GLD | Five-eighth | 22 | 1000 | 12 | 11 | 12 | 13 | 4.8 |
| 144 | Mawene Hiroti | CRO | Centre | 11 | 167 | 2 | 1 | 4 | 1 | 4.8 |
| 145 | Taine Tuaupiki | WAR | Fullback | 20 | 592 | 6 | 5 | 14 | 3 | 4.7 |
| 146 | Salesi Foketi | SYD | Bench | 22 | 172 | 3 | 0 | 3 | 2 | 4.7 |
| 147 | Keano Kini | GLD | Fullback | 24 | 1033 | 3 | 13 | 18 | 14 | 4.7 |
| 148 | Oregon Kaufusi | CRO | Bench | 20 | 152 | 1 | 2 | 2 | 2 | 4.6 |
| 149 | Euan Aitken | SOU | 2nd row | 18 | 240 | 6 | 0 | 5 | 0 | 4.6 |
| 150 | Sam Walker | SYD | Halfback | 21 | 1266 | 10 | 21 | 7 | 20 | 4.6 |
| 151 | Blaize Talagi | PEN | Five-eighth | 19 | 656 | 5 | 8 | 6 | 11 | 4.6 |
| 152 | Erin Clark | WAR | Lock | 24 | 571 | 6 | 6 | 8 | 6 | 4.5 |
| 153 | Tanah Boyd | WAR | Halfback | 10 | 562 | 3 | 10 | 3 | 9 | 4.5 |
| 154 | Ray Stone | DOL | Bench | 19 | 158 | 3 | 1 | 2 | 1 | 4.4 |
| 155 | Chanel Harris-Tavita | WAR | Five-eighth | 20 | 908 | 8 | 14 | 5 | 13 | 4.4 |
| 156 | Thomas Duffy | BRI | Five-eighth | 10 | 319 | 1 | 6 | 2 | 5 | 4.4 |
| 157 | Samuel Stonestreet | CRO | Winger | 12 | 230 | 4 | 2 | 4 | 0 | 4.3 |
| 158 | Zac Hosking | CBR | 2nd row | 21 | 280 | 6 | 1 | 4 | 1 | 4.3 |
| 159 | Cooper Bai | GLD | Bench | 23 | 235 | 2 | 1 | 5 | 2 | 4.3 |
| 160 | Isaiah Papali'i | PEN | 2nd row | 23 | 425 | 3 | 5 | 3 | 7 | 4.2 |
| 161 | Kurt Donoghoe | DOL | Bench | 15 | 357 | 2 | 5 | 3 | 5 | 4.2 |
| 162 | Jermaine McEwen | NEW | 2nd row | 20 | 293 | 2 | 3 | 5 | 2 | 4.1 |
| 163 | Jarome Luai | WST | Five-eighth | 20 | 907 | 4 | 14 | 5 | 14 | 4.1 |
| 164 | Jackson Ford | WAR | Prop | 14 | 260 | 4 | 0 | 6 | 0 | 3.9 |
| 165 | Oryn Keeley | MEL | 2nd row | 14 | 183 | 2 | 1 | 3 | 1 | 3.8 |
| 166 | Jordan Riki | BRI | 2nd row | 22 | 298 | 5 | 0 | 4 | 2 | 3.7 |
| 167 | Luciano Leilua | SGI | 2nd row | 14 | 217 | 2 | 0 | 3 | 3 | 3.7 |
| 168 | Mitchell Moses | PAR | Halfback | 19 | 1117 | 3 | 15 | 4 | 18 | 3.6 |
| 169 | Jack Williams | PAR | Prop | 24 | 339 | 2 | 3 | 5 | 2 | 3.5 |
| 170 | Clinton Gutherson | SGI | Fullback | 17 | 679 | 3 | 5 | 4 | 12 | 3.5 |
| 171 | Ronald Volkman | PAR | Five-eighth | 19 | 883 | 8 | 10 | 8 | 5 | 3.5 |
| 172 | Ben Talty | BRI | Bench | 20 | 171 | 2 | 1 | 2 | 1 | 3.5 |
| 173 | Lyhkan King-Togia | SGI | Five-eighth | 10 | 374 | 1 | 5 | 1 | 6 | 3.5 |
| 174 | Lachlan Galvin | CBY | Halfback | 24 | 1651 | 10 | 16 | 9 | 22 | 3.5 |
| 175 | Tino Fa'asuamaleaui | GLD | Prop | 21 | 408 | 2 | 3 | 4 | 5 | 3.4 |
| 176 | Trey Mooney | NEW | Prop | 22 | 310 | 5 | 0 | 5 | 0 | 3.2 |
| 177 | Jaeman Salmon | CBY | Lock | 24 | 466 | 3 | 3 | 6 | 3 | 3.2 |
| 178 | Ativalu Lisati | MEL | 2nd row | 10 | 156 | 3 | 0 | 1 | 1 | 3.2 |
| 179 | Isaiya Katoa | DOL | Halfback | 20 | 1162 | 2 | 17 | 1 | 17 | 3.2 |
| 180 | Joash Papalii | PAR | Fullback | 13 | 443 | 5 | 2 | 4 | 3 | 3.2 |
| 181 | Ethan Sanders | CBR | Halfback | 23 | 1393 | 3 | 18 | 6 | 17 | 3.2 |
| 182 | Connor Tracey | CBY | Fullback | 22 | 761 | 4 | 5 | 9 | 6 | 3.1 |
| 183 | Cameron Munster | MEL | Five-eighth | 19 | 953 | 4 | 11 | 5 | 10 | 3.1 |
| 184 | Luca Moretti | PAR | Prop | 18 | 161 | 1 | 0 | 4 | 0 | 3.1 |
| 185 | Xavier Willison | BRI | Prop | 24 | 355 | 7 | 0 | 4 | 0 | 3.1 |
| 186 | Lachlan Ilias | GLD | Halfback | 13 | 520 | 1 | 7 | 1 | 7 | 3.1 |
| 187 | Alec MacDonald | MEL | Bench | 19 | 163 | 2 | 0 | 2 | 1 | 3.1 |
| 188 | Jamal Fogarty | MAN | Halfback | 22 | 1331 | 4 | 23 | 4 | 9 | 3.0 |
| 189 | Stefano Utoikamanu | MEL | Prop | 24 | 334 | 3 | 1 | 5 | 1 | 3.0 |
| 190 | Kobe Hetherington | MAN | Prop | 17 | 170 | 1 | 0 | 3 | 1 | 2.9 |
| 191 | Dylan Brown | NEW | Halfback | 15 | 864 | 2 | 11 | 4 | 8 | 2.9 |
| 192 | Addin Fonua-Blake | CRO | Prop | 21 | 346 | 2 | 1 | 3 | 4 | 2.9 |
| 192 | Kulikefu Finefeuiaki | DOL | 2nd row | 22 | 346 | 3 | 1 | 5 | 1 | 2.9 |
| 194 | Lindsay Smith | PEN | Prop | 24 | 489 | 3 | 3 | 2 | 6 | 2.9 |
| 195 | Ashton Ward | SOU | Halfback | 13 | 854 | 1 | 10 | 1 | 12 | 2.8 |
| 196 | Tyran Wishart | MEL | Bench | 18 | 606 | 6 | 1 | 10 | 0 | 2.8 |
| 197 | Jason Taumalolo | NQL | Prop | 23 | 393 | 2 | 3 | 3 | 3 | 2.8 |
| 198 | Dylan Walker | PAR | Bench | 22 | 467 | 4 | 2 | 3 | 4 | 2.8 |
| 199 | Moses Leota | PEN | Prop | 24 | 327 | 1 | 2 | 2 | 4 | 2.8 |
| 200 | Sandon Smith | NEW | Halfback | 21 | 1357 | 1 | 14 | 2 | 19 | 2.6 |
| 201 | Daly Cherry-Evans | SYD | Five-eighth | 23 | 1246 | 6 | 11 | 5 | 11 | 2.6 |
| 202 | Max King | CBY | Prop | 20 | 304 | 2 | 0 | 4 | 2 | 2.6 |
| 203 | Heamasi Makasini | WST | Centre | 14 | 239 | 1 | 1 | 3 | 1 | 2.5 |
| 204 | Zane Harrison | GLD | Halfback | 11 | 559 | 0 | 6 | 1 | 7 | 2.5 |
| 205 | Payne Haas | BRI | Prop | 17 | 281 | 3 | 0 | 4 | 0 | 2.5 |
| 206 | Dylan Egan | SGI | 2nd row | 16 | 204 | 2 | 1 | 2 | 0 | 2.5 |
| 207 | Isaah Yeo | PEN | Lock | 18 | 411 | 2 | 2 | 1 | 5 | 2.4 |
| 208 | Thomas Hazelton | CRO | Bench | 22 | 249 | 2 | 0 | 3 | 1 | 2.4 |
| 209 | Jayden Sullivan | SOU | Bench | 14 | 377 | 1 | 3 | 3 | 2 | 2.4 |
| 210 | Thomas Flegler | DOL | Prop | 19 | 168 | 2 | 0 | 2 | 0 | 2.4 |
| 211 | Luke Brooks | MAN | Five-eighth | 15 | 856 | 2 | 7 | 3 | 8 | 2.3 |
| 212 | Trent Toelau | MEL | Bench | 11 | 472 | 1 | 4 | 3 | 3 | 2.3 |
| 213 | Demitric Vaimauga | WAR | Bench | 20 | 265 | 1 | 1 | 1 | 3 | 2.3 |
| 214 | Daniel Atkinson | SGI | Five-eighth | 21 | 1046 | 1 | 11 | 4 | 7 | 2.2 |
| 215 | Angus Crichton | SYD | 2nd row | 13 | 183 | 2 | 0 | 1 | 1 | 2.2 |
| 216 | Junior Paulo | PAR | Prop | 17 | 277 | 1 | 2 | 1 | 2 | 2.2 |
| 217 | Gehamat Shibasaki | BRI | Centre | 16 | 237 | 3 | 0 | 2 | 0 | 2.1 |
| 218 | Billy Phillips | PEN | Bench | 21 | 193 | 2 | 0 | 1 | 1 | 2.1 |
| 219 | Lachlan Hubner | SOU | Bench | 23 | 293 | 1 | 2 | 2 | 1 | 2.0 |
| 220 | Mitchell Barnett | WAR | Prop | 15 | 294 | 1 | 3 | 0 | 2 | 2.0 |
| 221 | Adam Reynolds | BRI | Halfback | 14 | 598 | 3 | 5 | 1 | 3 | 2.0 |
| 222 | James Fisher-Harris | WAR | Prop | 21 | 402 | 3 | 1 | 3 | 1 | 2.0 |
| 223 | Cameron McInnes | CRO | Lock | 17 | 302 | 1 | 0 | 2 | 3 | 2.0 |
| 224 | Siua Wong | SYD | 2nd row | 23 | 354 | 4 | 1 | 1 | 1 | 2.0 |
| 225 | Mat Croker | NEW | Lock | 24 | 426 | 1 | 1 | 1 | 5 | 1.9 |
| 226 | Reuben Cotter | NQL | Lock | 21 | 267 | 3 | 0 | 2 | 0 | 1.9 |
| 227 | Ethan Bullemor | MAN | Bench | 16 | 163 | 1 | 0 | 1 | 1 | 1.8 |
| 228 | Ben Hunt | BRI | Bench | 18 | 873 | 2 | 6 | 2 | 6 | 1.8 |
| 229 | Cooper Clarke | MEL | Bench | 24 | 274 | 2 | 0 | 2 | 1 | 1.8 |
| 230 | Brad Schneider | DOL | Bench | 13 | 715 | 2 | 4 | 1 | 6 | 1.8 |
| 231 | Taniela Paseka | MAN | Prop | 20 | 282 | 2 | 0 | 2 | 1 | 1.8 |
| 232 | Jock Madden | WST | Halfback | 15 | 809 | 1 | 6 | 1 | 6 | 1.7 |
| 233 | Patrick Carrigan | BRI | Lock | 18 | 414 | 1 | 2 | 1 | 3 | 1.7 |
| 234 | Tyson Frizell | NEW | Bench | 21 | 237 | 2 | 0 | 1 | 1 | 1.7 |
| 235 | Alex Seyfarth | WST | Bench | 23 | 297 | 2 | 1 | 2 | 0 | 1.7 |
| 236 | Francis Molo | DOL | Prop | 20 | 181 | 0 | 1 | 2 | 0 | 1.7 |
| 237 | Chris Randall | GLD | Lock | 21 | 364 | 1 | 1 | 2 | 2 | 1.6 |
| 238 | Brandon Smith | SOU | Hooker | 16 | 929 | 3 | 4 | 4 | 4 | 1.6 |
| 239 | Wayde Egan | WAR | Hooker | 23 | 2251 | 3 | 12 | 6 | 14 | 1.6 |
| 240 | Jacob Saifiti | NEW | Prop | 18 | 194 | 1 | 1 | 0 | 1 | 1.6 |
| 241 | Trent Loiero | MEL | Lock | 21 | 400 | 2 | 1 | 2 | 1 | 1.5 |
| 242 | Nat Butcher | SYD | Bench | 22 | 334 | 1 | 1 | 2 | 1 | 1.5 |
| 243 | Jesse Colquhoun | CRO | Lock | 21 | 340 | 3 | 0 | 2 | 0 | 1.5 |
| 244 | Nathan Brown | MAN | Bench | 19 | 344 | 0 | 1 | 1 | 3 | 1.4 |
| 245 | Blayke Brailey | CRO | Hooker | 19 | 2453 | 3 | 15 | 4 | 13 | 1.4 |
| 246 | Tallyn Da Silva | PAR | Hooker | 24 | 1995 | 12 | 3 | 9 | 4 | 1.4 |
| 247 | Moeaki Fotuaika | GLD | Prop | 24 | 362 | 1 | 0 | 2 | 2 | 1.4 |
| 248 | Keaon Koloamatangi | SOU | Prop | 24 | 508 | 2 | 1 | 3 | 1 | 1.4 |
| 249 | Harry Grant | MEL | Hooker | 21 | 2403 | 6 | 10 | 9 | 8 | 1.4 |
| 250 | Josh King | MEL | Prop | 24 | 292 | 2 | 0 | 2 | 0 | 1.4 |
| 251 | Owen Pattie | CBR | Hooker | 15 | 990 | 4 | 4 | 3 | 2 | 1.3 |
| 252 | Jack Cogger | PEN | Bench | 16 | 634 | 1 | 6 | 0 | 1 | 1.3 |
| 253 | Jamie Humphreys | SOU | Bench | 17 | 879 | 2 | 6 | 0 | 3 | 1.3 |
| 254 | Kyle Flanagan | SGI | Halfback | 21 | 1045 | 1 | 7 | 1 | 4 | 1.2 |
| 255 | Harrison Graham | NEW | Bench | 16 | 732 | 2 | 2 | 3 | 2 | 1.2 |
| 256 | Max Plath | DOL | Hooker | 19 | 1074 | 4 | 1 | 7 | 1 | 1.2 |
| 257 | Latu Fainu | WST | Bench | 13 | 248 | 0 | 1 | 1 | 1 | 1.2 |
| 258 | Sean Keppie | SOU | Bench | 17 | 168 | 1 | 0 | 1 | 0 | 1.2 |
| 259 | Corey Horsburgh | CBR | Prop | 22 | 422 | 2 | 1 | 1 | 1 | 1.2 |
| 260 | Sione Fainu | WST | Bench | 23 | 259 | 2 | 0 | 1 | 0 | 1.2 |
| 261 | Oliver Pascoe | GLD | Hooker | 20 | 1790 | 5 | 3 | 5 | 7 | 1.1 |
| 262 | Harry Hayes | CBY | Bench | 21 | 180 | 0 | 0 | 1 | 1 | 1.1 |
| 263 | Connor Watson | SYD | Bench | 23 | 652 | 1 | 2 | 0 | 4 | 1.1 |
| 264 | Tom Gilbert | DOL | Bench | 23 | 280 | 1 | 0 | 2 | 0 | 1.1 |
| 265 | Reed Mahoney | NQL | Hooker | 21 | 1703 | 4 | 4 | 6 | 4 | 1.1 |
| 266 | Sam Verrills | GLD | Hooker | 13 | 779 | 1 | 3 | 1 | 3 | 1.0 |
| 267 | Soni Luke | NQL | Bench | 18 | 882 | 2 | 2 | 2 | 3 | 1.0 |
| 268 | Coen Hess | NQL | Bench | 24 | 199 | 1 | 0 | 1 | 0 | 1.0 |
| 269 | Sam Healey | WAR | Bench | 21 | 708 | 2 | 1 | 4 | 0 | 1.0 |
| 270 | Alex Twal | WST | Lock | 16 | 308 | 0 | 1 | 0 | 2 | 1.0 |
| 271 | Victor Radley | SYD | Lock | 16 | 318 | 1 | 0 | 0 | 2 | 0.9 |
| 272 | Kurt Mann | CBY | Bench | 18 | 326 | 0 | 1 | 2 | 0 | 0.9 |
| 273 | Morgan Knowles | DOL | Lock | 23 | 327 | 1 | 0 | 2 | 0 | 0.9 |
| 274 | Peter Mamouzelos | SOU | Bench | 10 | 657 | 0 | 2 | 1 | 3 | 0.9 |
| 275 | Ryan Couchman | SGI | Lock | 20 | 336 | 1 | 0 | 1 | 1 | 0.9 |
| 275 | Tevita Tatola | SOU | Prop | 24 | 336 | 2 | 0 | 1 | 0 | 0.9 |
| 277 | Thomas Cant | NEW | Bench | 16 | 228 | 0 | 1 | 0 | 1 | 0.9 |
| 278 | Scott Sorensen | PEN | Bench | 23 | 232 | 0 | 0 | 2 | 0 | 0.9 |
| 279 | Jake Simpkin | MAN | Bench | 24 | 1908 | 0 | 6 | 2 | 7 | 0.8 |
| 280 | Brandon Wakeham | MAN | Hooker | 17 | 929 | 2 | 2 | 0 | 3 | 0.8 |
| 281 | Terrell May | WST | Prop | 23 | 536 | 1 | 0 | 3 | 0 | 0.8 |
| 282 | Ata Mariota | CBR | Bench | 24 | 272 | 1 | 0 | 1 | 0 | 0.7 |
| 283 | Reece Robson | SYD | Hooker | 19 | 1939 | 3 | 4 | 4 | 3 | 0.7 |
| 284 | Jacob Liddle | SGI | Bench | 14 | 839 | 2 | 0 | 2 | 2 | 0.7 |
| 285 | Tom Starling | CBR | Hooker | 23 | 1417 | 2 | 3 | 2 | 3 | 0.7 |
| 286 | Joseph Tapine | CBR | Prop | 24 | 443 | 1 | 0 | 1 | 1 | 0.7 |
| 287 | Apisai Koroisau | WST | Hooker | 19 | 2248 | 3 | 4 | 6 | 2 | 0.7 |
| 288 | Jeremy Marshall-King | DOL | Hooker | 16 | 1502 | 3 | 1 | 4 | 2 | 0.7 |
| 289 | Saxon Pryke | PAR | Bench | 10 | 151 | 0 | 0 | 0 | 1 | 0.7 |
| 290 | Ryley Smith | PAR | Hooker | 10 | 619 | 2 | 1 | 0 | 1 | 0.7 |
| 291 | Emre Guler | SGI | Prop | 16 | 161 | 1 | 0 | 0 | 0 | 0.6 |
| 292 | Fonua Pole | WST | Prop | 24 | 323 | 1 | 0 | 1 | 0 | 0.6 |
| 293 | Jake Trbojevic | MAN | Lock | 24 | 333 | 1 | 0 | 1 | 0 | 0.6 |
| 294 | Toby Couchman | SGI | Prop | 22 | 352 | 0 | 1 | 0 | 1 | 0.6 |
| 295 | Freddy Lussick | PEN | Hooker | 20 | 1882 | 4 | 1 | 4 | 1 | 0.5 |
| 296 | Griffin Neame | NQL | Bench | 22 | 195 | 0 | 0 | 0 | 1 | 0.5 |
| 297 | Naufahu Whyte | SYD | Prop | 23 | 411 | 0 | 0 | 2 | 0 | 0.5 |
| 298 | Bailey Hayward | CBY | Hooker | 24 | 2529 | 0 | 5 | 1 | 6 | 0.5 |
| 299 | Phoenix Crossland | NEW | Hooker | 22 | 1693 | 3 | 1 | 1 | 3 | 0.5 |
| 300 | Loko Jnr Pasifiki Tonga | SGI | Prop | 18 | 235 | 0 | 0 | 1 | 0 | 0.4 |
| 301 | Damien Cook | SGI | Hooker | 23 | 1977 | 2 | 3 | 1 | 2 | 0.4 |
| 302 | Hohepa Puru | CRO | Bench | 12 | 533 | 1 | 0 | 1 | 0 | 0.4 |
| 303 | Tanner Stowers-Smith | WAR | Bench | 19 | 268 | 0 | 0 | 1 | 0 | 0.4 |
| 304 | Leo Thompson | CBY | Prop | 19 | 280 | 0 | 0 | 0 | 1 | 0.4 |
| 305 | Cory Paix | BRI | Hooker | 18 | 1345 | 2 | 0 | 1 | 0 | 0.2 |
| 306 | Bronson Garlick | SOU | Hooker | 11 | 530 | 0 | 0 | 0 | 0 | 0.0 |
| 306 | Harrison Edwards | PAR | Bench | 13 | 414 | 0 | 0 | 0 | 0 | 0.0 |
| 306 | Jack De Belin | PAR | Lock | 18 | 174 | 0 | 0 | 0 | 0 | 0.0 |
| 306 | Jayden Brailey | CBR | Bench | 16 | 394 | 0 | 0 | 0 | 0 | 0.0 |
| 306 | Klese Haas | GLD | Bench | 23 | 198 | 0 | 0 | 0 | 0 | 0.0 |
| 306 | Morgan Smithies | CBR | Bench | 21 | 213 | 0 | 0 | 0 | 0 | 0.0 |
| 306 | Sam Tuivaiti | PAR | Bench | 14 | 150 | 0 | 0 | 0 | 0 | 0.0 |
| 306 | Spencer Leniu | SYD | Bench | 20 | 183 | 0 | 0 | 0 | 0 | 0.0 |
| 306 | Thomas Mikaele | NQL | Bench | 21 | 295 | 0 | 0 | 0 | 0 | 0.0 |
Why?
A follower sent us a DM about bang for buck: not who scores the most, but who gets the most done for the number of times they get the ball. I counted every touch of the 2026 NRL regular season to find out, and every try, line break and assist that came from them. Near the top of 314 players was a name already in the news.
- Now: Best is on about $700,000 to $750,000 a season, Michael Carayannis said on SEN in August.
- 21 October: the Knights reportedly offered about $4 million over 4 years,News Corp reported.
- 1 November: Best's deal runs to the end of 2027, so from 1 November other clubs can talk to Best.

Half the office is fumingThe other half know the value
4 tries all yearThe try list counts who finished it
15 try assistsThe most by any centre

The phone's openOther clubs can call from 1 November
The sales board
The try list only counts who put the ball down. Count the setting up too, and Best's 2026 reads like this:
4tries15try assists4line breaks16line-break assists39big moments
39big moments227touches10017.2per 100 touches
227touches39big moments1 in 5.8touches
31 of the 39 were for someone else, of them try assists. Something big every 5.8 touches. The typical NRL player, the middle of the 314The median: sort all 314 by impact per 100 touches and take the middle, 4.3. Derived., needs 23: Best does about 4 times as much with the ball. Only 2 players did more per touch:
| Rank | Player | Club | Per 100 touches | One every |
|---|---|---|---|---|
| 1 | Alex Johnston | SOU | 20.9 | 4.8 touches |
| 2 | Latrell Mitchell | SOU | 18.8 | 5.3 touches |
| 3 | Bradman Best | NEW | 17.2 | 5.8 touches |
| 4 | Casey McLean | PEN | 15.4 | 6.5 touches |
| 5 | Robert Toia | SYD | 15.2 | 6.6 touches |
Alex Johnston's 30 tries are in the try-scorer race. Latrell Mitchell played 11 games, so with a 12-game minimum Best is 2nd of 296.
Less ball, more done
Centres are the fair comparison: same spot on the field, same kind of ball. 38 played 10 or more games in the 3 or 4 jersey.
Best got the ball less than the average centre and did about 1.9 times as much with it
38 centres · games in jersey 3 or 4 only · 2026 regular seasonShow the numbers
| Rank | Centre | Club | Games at centre | Touches a game | Tries | Try assists | Line breaks | Line-break assists | Per 100 touches |
|---|---|---|---|---|---|---|---|---|---|
| 1 | Latrell Mitchell | SOU | 10 | 26.1 | 12 | 8 | 11 | 18 | 18.8 |
| 2 | Bradman Best | NEW | 14 | 16.2 | 4 | 15 | 4 | 16 | 17.2 |
| 3 | Robert Toia | SYD | 20 | 15.5 | 12 | 12 | 14 | 9 | 15.2 |
| 4 | Casey McLean | PEN | 17 | 17.6 | 9 | 10 | 11 | 15 | 15.1 |
| 5 | Tolutau Koula | MAN | 15 | 17.5 | 7 | 7 | 14 | 7 | 13.4 |
| 6 | Ali Leiataua | WAR | 19 | 12.8 | 5 | 7 | 7 | 12 | 12.7 |
| 7 | Simi Sasagi | CBR | 14 | 20.4 | 5 | 11 | 8 | 11 | 12.2 |
| 8 | Hugo Savala | SYD | 15 | 19.2 | 8 | 9 | 6 | 10 | 11.5 |
| 9 | Valentine Holmes | SGI | 24 | 16.8 | 10 | 8 | 16 | 10 | 10.9 |
| 10 | Matt Burton | CBY | 10 | 20.6 | 6 | 4 | 4 | 8 | 10.7 |
| 11 | Herbie Farnworth | DOL | 23 | 21.8 | 13 | 7 | 13 | 17 | 10.0 |
| 12 | Patrick Herbert | WST | 10 | 14.2 | 0 | 6 | 2 | 6 | 9.9 |
| 13 | Dane Gagai | NEW | 22 | 20.1 | 5 | 10 | 9 | 18 | 9.5 |
| 14 | Moses Suli | SGI | 14 | 14.3 | 4 | 5 | 2 | 8 | 9.5 |
| 15 | Jack Bostock | DOL | 13 | 22.4 | 3 | 11 | 4 | 9 | 9.3 |
| 16 | Tom Chester | NQL | 23 | 19.3 | 11 | 2 | 20 | 4 | 8.3 |
| 17 | Jojo Fifita | GLD | 20 | 15.9 | 8 | 4 | 11 | 3 | 8.2 |
| 18 | Bronson Xerri | CBY | 13 | 16.5 | 3 | 5 | 4 | 5 | 7.9 |
| 19 | Enari Tuala | CBY | 12 | 19.0 | 4 | 1 | 11 | 2 | 7.9 |
| 20 | Adam Pompey | WAR | 13 | 16.6 | 3 | 4 | 3 | 7 | 7.9 |
| 21 | Reuben Garrick | MAN | 23 | 19.0 | 11 | 4 | 11 | 8 | 7.8 |
| 22 | Will Penisini | PAR | 11 | 16.6 | 4 | 1 | 5 | 4 | 7.7 |
| 23 | Jesse Ramien | CRO | 14 | 16.1 | 6 | 2 | 8 | 1 | 7.6 |
| 24 | Jaxon Purdue | NQL | 17 | 22.5 | 7 | 5 | 11 | 5 | 7.3 |
| 25 | Kotoni Staggs | BRI | 21 | 15.8 | 9 | 2 | 7 | 6 | 7.3 |
| 26 | KL Iro | CRO | 20 | 17.3 | 12 | 1 | 10 | 2 | 7.3 |
| 27 | Sean Russell | PAR | 14 | 13.9 | 3 | 4 | 3 | 4 | 7.2 |
| 28 | AJ Brimson | GLD | 18 | 20.6 | 6 | 6 | 8 | 6 | 7.0 |
| 29 | Jack Howarth | MEL | 17 | 16.1 | 6 | 3 | 5 | 5 | 7.0 |
| 30 | Paul Alamoti | PEN | 18 | 16.2 | 2 | 4 | 7 | 7 | 6.9 |
| 31 | Sebastian Kris | CBR | 11 | 16.2 | 4 | 0 | 5 | 3 | 6.7 |
| 32 | Jordan Samrani | PAR | 14 | 18.2 | 8 | 1 | 8 | 0 | 6.7 |
| 33 | Matthew Timoko | CBR | 18 | 18.2 | 6 | 2 | 9 | 4 | 6.4 |
| 34 | Nick Meaney | MEL | 17 | 16.5 | 5 | 3 | 7 | 2 | 6.0 |
| 35 | Jack Wighton | SOU | 18 | 16.8 | 4 | 5 | 3 | 6 | 5.9 |
| 36 | Stephen Crichton | CBY | 10 | 20.6 | 4 | 2 | 2 | 3 | 5.3 |
| 37 | Heamasi Makasini | WST | 11 | 16.4 | 1 | 1 | 2 | 1 | 2.8 |
| 38 | Gehamat Shibasaki | BRI | 13 | 16.5 | 2 | 0 | 2 | 0 | 1.9 |
Best got the ball 16.2 times a game, against 17.8 for the average centre, and did about 1.9 times as much with it: 17.2 per 100 touches against 9.0. Only Latrell Mitchell did more per touch, on 26.1 touches a game.
| Centre | Games | Try assists | Line-break assists |
|---|---|---|---|
| Bradman Best | 14 | 15 | 16 |
| Robert Toia | 20 | 12 | 9 |
| Jack Bostock | 13 | 11 | 9 |
| Simi Sasagi | 14 | 11 | 11 |
15 try assists is the most by any centre. line-break assists is 4th, behind Dane Gagai (18), Latrell Mitchell (18), Herbie Farnworth (17).
Not a one-off
Before the chart, a guess: in how many of Best's 18 games of 2026, finals included, did Best set up at least one try?
Every Bradman Best game of 2026: drag the line
try assists, all 18 games, finals included · Knights wins marked under the columnsOver 0.5: 12/18 games · Knights won: 8/12 games
Show the numbers
| Date | Round | Opponent | Touches | Tries | Try assists | Line breaks | Line-break assists | Knights |
|---|---|---|---|---|---|---|---|---|
| 28 Feb 2026 | 1 | v NQL | 20 | 1 | 0 | 0 | 0 | W 28-18 |
| 15 Mar 2026 | 2 | at MAN | 19 | 0 | 2 | 1 | 1 | W 36-16 |
| 21 Mar 2026 | 3 | v WAR | 14 | 0 | 1 | 0 | 1 | L 12-38 |
| 28 Mar 2026 | 4 | at CBY | 13 | 0 | 0 | 0 | 0 | W 24-16 |
| 5 Apr 2026 | 5 | v CBR | 7 | 0 | 1 | 0 | 1 | W 32-12 |
| 3 May 2026 | 9 | v SOU | 17 | 0 | 3 | 1 | 3 | W 42-38 |
| 9 May 2026 | 10 | at SGI | 16 | 1 | 3 | 0 | 3 | W 44-10 |
| 19 June 2026 | 16 | v SGI | 19 | 0 | 1 | 0 | 0 | W 22-20 |
| 28 June 2026 | 17 | v WST | 19 | 1 | 0 | 1 | 1 | W 12-6 |
| 17 July 2026 | 20 | at CRO | 17 | 0 | 2 | 0 | 1 | L 18-20 |
| 24 July 2026 | 21 | v SYD | 18 | 1 | 0 | 0 | 0 | L 22-23 |
| 1 Aug 2026 | 22 | at BRI | 16 | 0 | 1 | 0 | 1 | W 30-6 |
| 22 Aug 2026 | 25 | v MAN | 15 | 0 | 0 | 1 | 0 | L 24-44 |
| 30 Aug 2026 | 26 | at WAR | 17 | 0 | 1 | 0 | 4 | L 32-46 |
| 11 Sept 2026 | Final (28) | at SOU | 25 | 0 | 0 | 0 | 0 | W 20-10 |
| 20 Sept 2026 | Final (29) | at WAR | 17 | 0 | 1 | 1 | 0 | W 12-10 |
| 27 Sept 2026 | Final (30) | at PEN | 20 | 0 | 1 | 1 | 0 | W 22-14 |
| 4 Oct 2026 | Final (31) | at SYD | 16 | 0 | 1 | 0 | 1 | L 18-19 |
With the line at half a try assist, 12 of 18 games clear it, 3 of them finals on the way to the 19-18 Grand Final loss to the Roosters. Drag it up to 1.5 and 4 games are left; the most in a game was 3, twice.
A different job
2025 was good already: 10.7 per 100 touches, 22nd of 297. 2026 was a different shape.
Best's own tries and breaks went down; the set-ups per touch went from 5.5 to 13.7
per 100 touches · regular season · the rank is of that season's crowd202522nd of 297
20263rd of 314
Show the numbers
| Season | Games | Touches | Tries | Line breaks | Try assists | Line-break assists | Own per 100 | Set up per 100 | Per 100 touches | Rank |
|---|---|---|---|---|---|---|---|---|---|---|
| 2025 | 18 | 347 | 6 | 12 | 7 | 12 | 5.2 | 5.5 | 10.7 | 22nd of 297 |
| 2026 | 14 | 227 | 4 | 4 | 15 | 16 | 3.5 | 13.7 | 17.2 | 3rd of 314 |
Fewer of Best's own tries and breaks, and more than twice the set-ups per touch: 5.5 to 13.7.
| 2025 | 2026 | |
|---|---|---|
| Games | 18 | 14 |
| Touches a game | 19.3 | 16.2 |
| Tries | 6 | 4 |
| Line breaks | 12 | 4 |
| Try assists | 7 | 15 |
| Line-break assists | 12 | 16 |
| Per 100 touches | 10.7 | 17.2 |
Less ball, fewer of Best's own tries, and the ball going to someone else at the right time.
So what's Best worth?
The numbers can't put a price on a centre. They don't see defence, size or the injury history Zero Tackle's Scott Pryde called the main question about Best's value.
The Knights went 9-5 in the regular-season games Best played and 5-5 in the 10 without, a small sample that settles nothing on its own.
Show the numbers
| Round | Opponent | Knights | Best played |
|---|---|---|---|
| 1 | v NQL | W 28-18 | Yes |
| 2 | at MAN | W 36-16 | Yes |
| 3 | v WAR | L 12-38 | Yes |
| 4 | at CBY | W 24-16 | Yes |
| 5 | v CBR | W 32-12 | Yes |
| 6 | at WST | L 22-42 | No |
| 7 | at SYD | L 24-38 | No |
| 8 | v PEN | L 12-44 | No |
| 9 | v SOU | W 42-38 | Yes |
| 10 | at SGI | W 44-10 | Yes |
| 11 | at GLD | W 36-12 | No |
| 13 | v PAR | W 28-22 | No |
| 14 | at MEL | L 30-32 | No |
| 16 | v SGI | W 22-20 | Yes |
| 17 | v WST | W 12-6 | Yes |
| 18 | v DOL | W 13-12 | No |
| 19 | at SOU | L 24-26 | No |
| 20 | at CRO | L 18-20 | Yes |
| 21 | v SYD | L 22-23 | Yes |
| 22 | at BRI | W 30-6 | Yes |
| 23 | at CBR | W 30-24 | No |
| 24 | v GLD | W 36-26 | No |
| 25 | v MAN | L 24-44 | Yes |
| 26 | at WAR | L 32-46 | Yes |
One camp sees 4 tries and a reported offer of about $1 million a season. The other sees 31 set-ups and the 3rd-best impact per touch in the NRL.
14 games is a short season, and whether 17.2 holds up over a full one is what this can't say. I'll run the same count when 2027 is 10 rounds old, wherever Best is playing.
Summary
- Per 100 touches
- 4.3the typical player17.2Bradman Best, 3rd of 314
- Try assists by a centre
- 12Robert Toia, next best15Bradman Best, the most
- 2025 to 2026
- 10.72025, 22nd17.22026, 3rd
The working
Definitions, sources and when the numbers were read
- Impact
- Tries + try assists + line breaks + line-break assists, as the NRL feed records them. Impact per 100 touches is impact ÷ touches × 100; one every N touches is touches ÷ impact. Both derived.
- Touches
- The feed's receipts: every time a player receives the ball, dummy-half takes included.
- Window
- NRL 2026 regular season, rounds 1 to 27: 204 complete games, the last on 6 Sept 2026. The 9 finals are left out of every table, because only 8 clubs play them; Best's 4 are in Figure 3 only.
- The crowd
- Every player with 10 or more games on the field and 150 or more touches: 314. A player who changed clubs is one row. With a 12-game minimum instead, 296 players and Best 2nd.
- Median
- The middle of the 314 rates, 4.3 per 100 touches, so one every 23. Derived.
- Centres
- Players with 10 or more games in jersey 3 or 4, counted from those games only: 38. The average centre is the 38 pooled: total impact over total touches, total touches over total games. Positions come from the jersey worn each game, recorded for every 2026 game.
- 2025
- The same rules on the 2025 regular season: 297 players. Best's 18 games, 347 touches.
- Knights
- Regular-season results from the final scores: 9-5 in the 14 games Best played, 5-5 in the 10 without.
- Contract
- Current deal and 1 November: Michael Carayannis on SEN's Kick Off, reported by SEN, 27 August 2026. The offer of about $4 million over 4 years: reported by News Corp, viaZero Tackle, October 2026, not confirmed by the club. Injury history: Zero Tackle, 14 August 2026.
- Read
- 27 October 2026, from Punt's database.
- Sources
- The competition's own record is at nrl.com.
- Not in this article
- Defence, kicks, minutes, what Best will be paid, and prices.
- Sources and terms
- Every source Punt uses, with its licence, is on Credits. The terms are defined in the Glossary, and the methodology page sets out where every number comes from and the rules it follows.