Every 37-a-game season ever, and Luka's 39.0
points a game, single NBA regular seasons · every season at 37 or moreShow the numbers
| Player | Season | Points a game | Games |
|---|---|---|---|
| Wilt Chamberlain | 1961-62 | 50.36 | 80 |
| Wilt Chamberlain | 1962-63 | 44.83 | 80 |
| Luka Dončić | 2026-27 | 39.00 | 12 |
| Wilt Chamberlain | 1960-61 | 38.39 | 79 |
| Elgin Baylor | 1961-62 | 38.30 | 48 |
| Wilt Chamberlain | 1959-60 | 37.60 | 72 |
| Michael Jordan | 1986-87 | 37.09 | 82 |
Why?
Our video says Luka Dončić is mixing all three this season: Michael Jordan's volume, Stephen Curry's efficiency and Russell Westbrook's all-round game. That's a big claim after 12 games, so I counted every season Luka is chasing, on all three ladders at once.
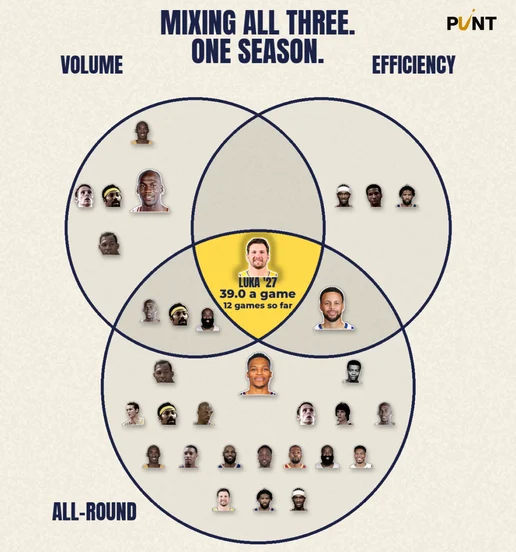
Mixing all three0:00, every face in the Venn
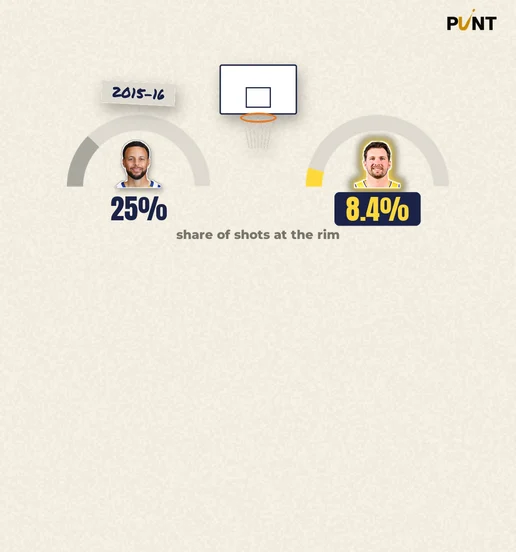
25% v 8.4%0:33, shots at the rim

People say0:40, the receipts
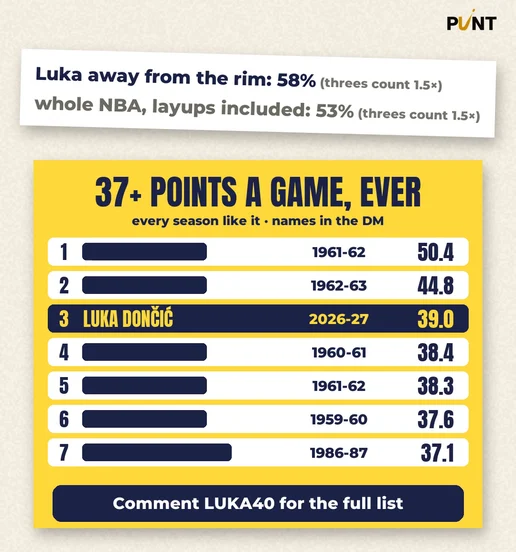
39.0, 3rd ever1:29, the end card
Figure 1 is the first ladder. a game is 3rd ever, behind two Wilt Chamberlain seasons, and the most since 1962-63.
Three circles, one season
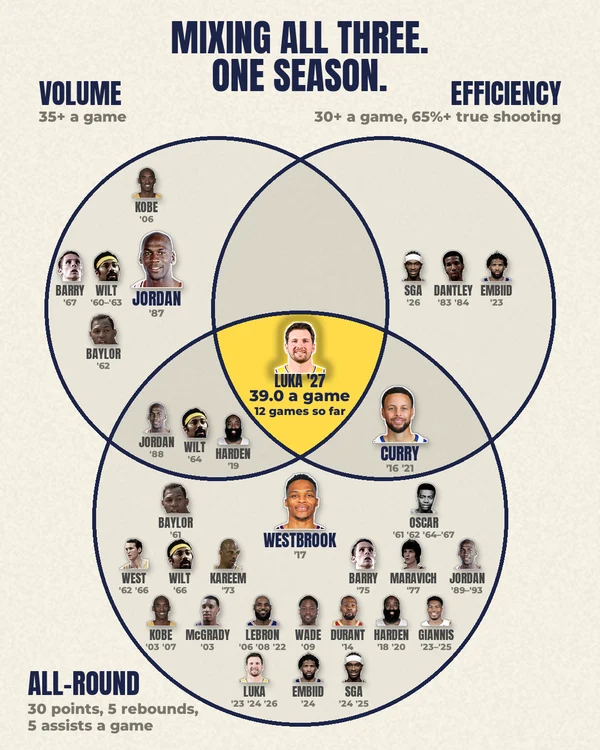
Put every NBA season ever into three circles: 35 or more points a game, 30 a game at 65% true shooting or better, and 30 points, 5 rebounds and 5 assists a game. True shooting is a shooting percentage that gives a three its extra point and counts free throws too, so it's the fairest single number for how efficiently someone scores.
Three circles, and one season in the middle
every NBA regular season · Volume: 35+ a game · Efficiency: 30+ a game at 65%+ true shooting · All-round: 30 points, 5 rebounds, 5 assists a gameVolume 35+ a game11 other seasons
- Wilt Chamberlain 1961-6250.4
- Wilt Chamberlain 1962-6344.8
- Wilt Chamberlain 1960-6138.4
- Elgin Baylor 1961-62 · 48 games38.3
- Wilt Chamberlain 1959-6037.6
- Michael Jordan 1986-8737.1
- Wilt Chamberlain 1963-64 · also All-round36.9
- James Harden 2018-19 · also All-round36.1
- Rick Barry 1966-6735.6
- Kobe Bryant 2005-0635.4
- Michael Jordan 1987-88 · also All-round35.0
Efficiency 30+ a game, 65%+ true shooting6 other seasons
- Stephen Curry 2015-16 · also All-round66.9%
- Shai Gilgeous-Alexander 2025-2666.5%
- Adrian Dantley 1982-83 · 22 games66.1%
- Stephen Curry 2020-21 · also All-round65.5%
- Joel Embiid 2022-2365.5%
- Adrian Dantley 1983-8465.2%
All-round 30 points, 5 rebounds, 5 assists43 other seasons · points/rebounds/assists
- Elgin Baylor 1960-6134.8/19.8/5.1
- Oscar Robertson 1960-6130.5/10.1/9.7
- Jerry West 1961-6230.8/7.9/5.4
- Oscar Robertson 1961-6230.8/12.5/11.4
- Oscar Robertson 1963-6431.4/9.9/11.0
- Wilt Chamberlain 1963-64 · also Volume36.9/22.3/5.0
- Oscar Robertson 1964-6530.4/9.0/11.5
- Jerry West 1965-6631.3/7.1/6.1
- Oscar Robertson 1965-6631.3/7.7/11.1
- Wilt Chamberlain 1965-6633.5/24.6/5.2
- Oscar Robertson 1966-6730.5/6.2/10.7
- Kareem Abdul-Jabbar 1972-7330.2/16.1/5.0
- Rick Barry 1974-7530.6/5.7/6.2
- Pete Maravich 1976-7731.1/5.1/5.4
- Michael Jordan 1987-88 · also Volume35.0/5.5/5.9
- Michael Jordan 1988-8932.5/8.0/8.0
- Michael Jordan 1989-9033.6/6.9/6.3
- Michael Jordan 1990-9131.5/6.0/5.5
- Michael Jordan 1991-9230.1/6.4/6.1
- Michael Jordan 1992-9332.6/6.7/5.5
- Kobe Bryant 2002-0330.0/6.9/5.9
- Tracy McGrady 2002-0332.1/6.5/5.5
- LeBron James 2005-0631.4/7.0/6.6
- Kobe Bryant 2006-0731.6/5.7/5.4
- LeBron James 2007-0830.0/7.9/7.2
- Dwyane Wade 2008-0930.2/5.0/7.5
- Kevin Durant 2013-1432.0/7.4/5.5
- Stephen Curry 2015-16 · also Efficiency30.1/5.4/6.7
- Russell Westbrook 2016-1731.6/10.7/10.4
- James Harden 2017-1830.4/5.4/8.8
- James Harden 2018-19 · also Volume36.1/6.6/7.5
- James Harden 2019-2034.3/6.6/7.5
- Stephen Curry 2020-21 · also Efficiency32.0/5.5/5.8
- LeBron James 2021-2230.3/8.2/6.2
- Giannis Antetokounmpo 2022-2331.1/11.8/5.7
- Luka Dončić 2022-2332.4/8.6/8.0
- Giannis Antetokounmpo 2023-2430.4/11.5/6.5
- Joel Embiid 2023-24 · 39 games34.7/11.0/5.6
- Luka Dončić 2023-2433.9/9.2/9.8
- Shai Gilgeous-Alexander 2023-2430.1/5.5/6.2
- Giannis Antetokounmpo 2024-2530.4/11.9/6.5
- Shai Gilgeous-Alexander 2024-2532.7/5.0/6.4
- Luka Dončić 2025-2633.5/7.7/8.3
In all three: Luka Dončić, 2026-27, 12 games so far. In two: Wilt Chamberlain, 1963-64 (Volume and All-round); Michael Jordan, 1987-88 (Volume and All-round); James Harden, 2018-19 (Volume and All-round); Stephen Curry, 2015-16 (Efficiency and All-round); Stephen Curry, 2020-21 (Efficiency and All-round), and nobody else.
Show the numbers
| Circle | Player | Season | Points | Rebounds | Assists | True shooting |
|---|---|---|---|---|---|---|
| Volume | Wilt Chamberlain | 1959-60 | 37.6 | 27.0 | 2.3 | 49.3% |
| Volume | Wilt Chamberlain | 1960-61 | 38.4 | 27.2 | 1.9 | 51.9% |
| Volume | Elgin Baylor | 1961-62 | 38.3 | 18.6 | 4.6 | – |
| Volume | Wilt Chamberlain | 1961-62 | 50.4 | 25.7 | 2.4 | 53.6% |
| Volume | Wilt Chamberlain | 1962-63 | 44.8 | 24.3 | 3.4 | 55.0% |
| Volume and All-round | Wilt Chamberlain | 1963-64 | 36.9 | 22.3 | 5.0 | 53.7% |
| Volume | Rick Barry | 1966-67 | 35.6 | 9.2 | 3.6 | 53.1% |
| Volume | Michael Jordan | 1986-87 | 37.1 | 5.2 | 4.6 | 56.2% |
| Volume and All-round | Michael Jordan | 1987-88 | 35.0 | 5.5 | 5.9 | 60.3% |
| Volume | Kobe Bryant | 2005-06 | 35.4 | 5.3 | 4.5 | 55.9% |
| Volume and All-round | James Harden | 2018-19 | 36.1 | 6.6 | 7.5 | 61.6% |
| Efficiency | Adrian Dantley | 1982-83 | 30.7 | 6.4 | 4.8 | 66.1% |
| Efficiency | Adrian Dantley | 1983-84 | 30.6 | 5.7 | 3.9 | 65.2% |
| Efficiency and All-round | Stephen Curry | 2015-16 | 30.1 | 5.4 | 6.7 | 66.9% |
| Efficiency and All-round | Stephen Curry | 2020-21 | 32.0 | 5.5 | 5.8 | 65.5% |
| Efficiency | Joel Embiid | 2022-23 | 33.1 | 10.2 | 4.2 | 65.5% |
| Efficiency | Shai Gilgeous-Alexander | 2025-26 | 31.1 | 4.3 | 6.6 | 66.5% |
| All-round | Elgin Baylor | 1960-61 | 34.8 | 19.8 | 5.1 | 49.8% |
| All-round | Oscar Robertson | 1960-61 | 30.5 | 10.1 | 9.7 | 55.5% |
| All-round | Jerry West | 1961-62 | 30.8 | 7.9 | 5.4 | 52.4% |
| All-round | Oscar Robertson | 1961-62 | 30.8 | 12.5 | 11.4 | 55.4% |
| All-round | Oscar Robertson | 1963-64 | 31.4 | 9.9 | 11.0 | 57.6% |
| All-round | Oscar Robertson | 1964-65 | 30.4 | 9.0 | 11.5 | 56.1% |
| All-round | Jerry West | 1965-66 | 31.3 | 7.1 | 6.1 | 57.3% |
| All-round | Oscar Robertson | 1965-66 | 31.3 | 7.7 | 11.1 | 56.3% |
| All-round | Wilt Chamberlain | 1965-66 | 33.5 | 24.6 | 5.2 | 54.7% |
| All-round | Oscar Robertson | 1966-67 | 30.5 | 6.2 | 10.7 | 58.3% |
| All-round | Kareem Abdul-Jabbar | 1972-73 | 30.2 | 16.1 | 5.0 | 58.0% |
| All-round | Rick Barry | 1974-75 | 30.6 | 5.7 | 6.2 | 50.9% |
| All-round | Pete Maravich | 1976-77 | 31.1 | 5.1 | 5.4 | 49.2% |
| All-round | Michael Jordan | 1988-89 | 32.5 | 8.0 | 8.0 | 61.4% |
| All-round | Michael Jordan | 1989-90 | 33.6 | 6.9 | 6.3 | 60.6% |
| All-round | Michael Jordan | 1990-91 | 31.5 | 6.0 | 5.5 | 60.5% |
| All-round | Michael Jordan | 1991-92 | 30.1 | 6.4 | 6.1 | 57.9% |
| All-round | Michael Jordan | 1992-93 | 32.6 | 6.7 | 5.5 | 56.4% |
| All-round | Kobe Bryant | 2002-03 | 30.0 | 6.9 | 5.9 | 55.0% |
| All-round | Tracy McGrady | 2002-03 | 32.1 | 6.5 | 5.5 | 56.4% |
| All-round | LeBron James | 2005-06 | 31.4 | 7.0 | 6.6 | 56.8% |
| All-round | Kobe Bryant | 2006-07 | 31.6 | 5.7 | 5.4 | 58.0% |
| All-round | LeBron James | 2007-08 | 30.0 | 7.9 | 7.2 | 56.8% |
| All-round | Dwyane Wade | 2008-09 | 30.2 | 5.0 | 7.5 | 57.4% |
| All-round | Kevin Durant | 2013-14 | 32.0 | 7.4 | 5.5 | 63.5% |
| All-round | Russell Westbrook | 2016-17 | 31.6 | 10.7 | 10.4 | 55.4% |
| All-round | James Harden | 2017-18 | 30.4 | 5.4 | 8.8 | 61.9% |
| All-round | James Harden | 2019-20 | 34.3 | 6.6 | 7.5 | 62.6% |
| All-round | LeBron James | 2021-22 | 30.3 | 8.2 | 6.2 | 61.9% |
| All-round | Giannis Antetokounmpo | 2022-23 | 31.1 | 11.8 | 5.7 | 60.5% |
| All-round | Luka Dončić | 2022-23 | 32.4 | 8.6 | 8.0 | 60.9% |
| All-round | Giannis Antetokounmpo | 2023-24 | 30.4 | 11.5 | 6.5 | 64.9% |
| All-round | Joel Embiid | 2023-24 | 34.7 | 11.0 | 5.6 | 64.4% |
| All-round | Luka Dončić | 2023-24 | 33.9 | 9.2 | 9.8 | 61.7% |
| All-round | Shai Gilgeous-Alexander | 2023-24 | 30.1 | 5.5 | 6.2 | 63.6% |
| All-round | Giannis Antetokounmpo | 2024-25 | 30.4 | 11.9 | 6.5 | 62.5% |
| All-round | Shai Gilgeous-Alexander | 2024-25 | 32.7 | 5.0 | 6.4 | 63.7% |
| All-round | Luka Dončić | 2025-26 | 33.5 | 7.7 | 8.3 | 61.6% |
| All three | Luka Dončić | 2026-27 | 39.0 | 7.2 | 7.8 | 66.0% |
Luka's 2026-27 is the only season in all three circles. 5 others are in two:
- Volume and All-round: Wilt Chamberlain's 1963-64, Michael Jordan's 1987-88 and James Harden's 2018-19, at 53.7%, 60.3% and 61.6% true shooting.
- Efficiency and All-round: Stephen Curry's 2015-16 and 2020-21, at 30.1 and 32.0 a game.
Nobody else is in two. The closest:
- Giannis, 2023-24: All-round, with 64.9% true shooting, 0.1 short of Efficiency.
- Baylor, 1960-61: All-round, with 34.8 a game, 0.2 short of Volume.
- Dantley, 1982-83: Efficiency, with 4.8 assists, 0.2 short of All-round.
- Embiid, 2023-24: All-round, with 34.7 a game, 0.3 short of Volume.
- Jokić: 29.6 a game in 2024-25 and 27.7 in 2025-26, at 66.3% and 67.0% true shooting with 12.7 rebounds and 10.2 assists. 0.4 more points a game and 2024-25 would sit in two circles.
- Rounding: Jordan's 1987-88 was 34.98 a game, shown as 35.0, so it counts.
- 12 games so far: Luka is at 7.2 rebounds and 7.8 assists a game. A game with no rebounds would still leave 6.6, and it would take 6 straight games without one to drop it under 5.
Here's how far up each ladder Luka is.
| Rung | The mark | Luka, 2026-27 |
|---|---|---|
| Volume | Jordan, 37.1 (1986-87) | 39.0, 3rd ever |
| Efficiency | Curry, 66.9% (2015-16) | 66.0%, 4th |
| All-round | Westbrook, 31.6 / 10.7 / 10.4 (2016-17) | 7.2 rebounds, 7.8 assists: not there |
| 35 and 7 | Only Harden (2018-19) | Ahead on all four |
Almost Curry
On efficiency, the mark is Curry's 2015-16: 30.1 a game at 66.9% true shooting, the season Curry became the first unanimous MVP.
Luka's 66.0% is 4th of every 30-point season
true shooting %, the 12 most efficient seasons of 30+ points a game · the axis starts at 62%Show the numbers
| Player | Season | True shooting | Points a game | Games |
|---|---|---|---|---|
| Stephen Curry | 2015-16 | 66.9% | 30.1 | 79 |
| Shai Gilgeous-Alexander | 2025-26 | 66.5% | 31.1 | 68 |
| Adrian Dantley | 1982-83 | 66.1% | 30.7 | 22 |
| Luka Dončić | 2026-27 | 66.0% | 39.0 | 12 |
| Stephen Curry | 2020-21 | 65.5% | 32.0 | 63 |
| Joel Embiid | 2022-23 | 65.5% | 33.1 | 66 |
| Adrian Dantley | 1983-84 | 65.2% | 30.6 | 79 |
| Giannis Antetokounmpo | 2023-24 | 64.9% | 30.4 | 73 |
| Damian Lillard | 2022-23 | 64.5% | 32.2 | 58 |
| Joel Embiid | 2023-24 | 64.4% | 34.7 | 39 |
| Shai Gilgeous-Alexander | 2024-25 | 63.7% | 32.7 | 76 |
| Shai Gilgeous-Alexander | 2023-24 | 63.6% | 30.1 | 75 |
Luka's 66.0% is 4th of every 30-point season, behind Curry, Shai Gilgeous-Alexander's 2025-26 (66.5%) and Adrian Dantley's 1982-83 (66.1%, in 22 games). At 35 a game it has no company: the best true shooting of any other 35-a-game season is James Harden's 2018-19, 61.6%.
And it's on more of the work than almost anyone has done. Usage is the share of a team's plays a player finishes, with a shot, a free throw or a turnover, while on the court. Only two seasons have used 40%:
| Season | Usage | True shooting |
|---|---|---|
| Russell Westbrook 2016-17 | 41.6% | 55.4% |
| James Harden 2018-19 | 40.5% | 61.6% |
| Luka Dončić 2026-27 | 40.3% | 66.0% |
Luka's is Basketball-Reference's figure after 12 games, 3rd ever.
The all-round rung
Westbrook's 2016-17 is the other mark: 31.6 points, 10.7 rebounds and 10.4 assists a game, 30 points and a triple-double for a whole season. Only Oscar Robertson's 1961-62 has done it too.
30 and a triple-double: two seasons, and Luka's short of it
a game, whole regular seasons · the dashed lines are 30 points, 10 rebounds and 10 assistsPoints
30 points
Rebounds
10 rebounds
Assists
10 assists
Show the numbers
| Player | Season | Points | Rebounds | Assists |
|---|---|---|---|---|
| Oscar Robertson | 1961-62 | 30.8 | 12.5 | 11.4 |
| Russell Westbrook | 2016-17 | 31.6 | 10.7 | 10.4 |
| Luka Dončić | 2026-27 | 39.0 | 7.2 | 7.8 |
Luka is short here: 7.2 rebounds and 7.8 assists, not 10 and 10. That's why the third circle is 30 points, 5 rebounds and 5 assists a game, a line Luka has cleared before, in 2022-23, 2023-24 and 2025-26.
35 and 7
Put volume and passing together and the list is one name long. Over a whole season, only James Harden's 2018-19 has 35 points and 7 assists a game.
35 and 7: Luka ahead of Harden on all four
a game, and true shooting % · the dashed lines are 35 points, 7 rebounds and 7 assistsPoints
35 points
Rebounds
7 rebounds
Assists
7 assists
True shooting %
Show the numbers
| Harden 2018-19 | Luka 2026-27 | |
|---|---|---|
| Points | 36.1 | 39.0 |
| Rebounds | 6.6 | 7.2 |
| Assists | 7.5 | 7.8 |
| True shooting | 61.6% | 66.0% |
Luka is ahead of Harden on all four numbers, and assists is the closest, 7.8 to 7.5. No completed season has ever had 35, 7 and 7.
The shot diet
The video's line was “with barely any layups”. Curry took about 1 shot in 4 at the rim in 2015-16. Luka takes 1 in 12.
1 shot in 4 at the rim, and 1 in 12
field-goal attempts at the rim (about 4 feet or closer) as a share of all of them · one ball a shot, the filled one at the rimStephen Curry 2015-161 shot in 4 at the rim 24.9%
Luka Dončić 2026-271 shot in 12 at the rim 8.4%
Show the numbers
| At the rim | Share | |
|---|---|---|
| Curry 2015-16 | 24.9% | |
| Luka 2026-27 | 25 of 296 | 8.4% |
Of Luka's 296 shots this season, 25 came at the rim: 8.4%.
Below every 30-point season with rim data
shots at the rim as a share of all shots · every completed 30-point season since 2000-01, 36 dots, and Luka's 2026-27Show the numbers
| Player | Season | At the rim | Points a game |
|---|---|---|---|
| Luka Dončić | 2026-27 | 8.4% | 39.0 |
| Luka Dončić | 2025-26 | 11.1% | 33.5 |
| Luka Dončić | 2023-24 | 15.9% | 33.9 |
| Stephen Curry | 2020-21 | 19.4% | 32.0 |
| Kobe Bryant | 2005-06 | 20.7% | 35.4 |
| Luka Dončić | 2022-23 | 21.6% | 32.4 |
| Kobe Bryant | 2002-03 | 21.9% | 30.0 |
| Kobe Bryant | 2006-07 | 23.1% | 31.6 |
| Kevin Durant | 2013-14 | 24.5% | 32.0 |
| Allen Iverson | 2001-02 | 24.6% | 31.4 |
| Kevin Durant | 2009-10 | 24.8% | 30.1 |
| Bradley Beal | 2020-21 | 24.8% | 31.3 |
| Stephen Curry | 2015-16 | 24.9% | 30.1 |
| Allen Iverson | 2000-01 | 25.1% | 31.1 |
| Shai Gilgeous-Alexander | 2024-25 | 25.3% | 32.7 |
| Damian Lillard | 2022-23 | 26.8% | 32.2 |
| Tracy McGrady | 2002-03 | 27.0% | 32.1 |
| James Harden | 2018-19 | 27.0% | 36.1 |
| Shai Gilgeous-Alexander | 2025-26 | 27.4% | 31.1 |
| Bradley Beal | 2019-20 | 27.9% | 30.5 |
| James Harden | 2019-20 | 28.0% | 34.3 |
| Joel Embiid | 2021-22 | 28.9% | 30.6 |
| Jayson Tatum | 2022-23 | 29.0% | 30.1 |
| Shai Gilgeous-Alexander | 2023-24 | 30.1% | 30.1 |
| Allen Iverson | 2005-06 | 30.4% | 33.0 |
| Russell Westbrook | 2016-17 | 30.7% | 31.6 |
| James Harden | 2017-18 | 31.1% | 30.4 |
| Joel Embiid | 2022-23 | 31.7% | 33.1 |
| Allen Iverson | 2004-05 | 31.9% | 30.7 |
| Dwyane Wade | 2008-09 | 33.9% | 30.2 |
| Shai Gilgeous-Alexander | 2022-23 | 35.8% | 31.4 |
| LeBron James | 2005-06 | 36.6% | 31.4 |
| LeBron James | 2007-08 | 38.4% | 30.0 |
| LeBron James | 2021-22 | 39.1% | 30.3 |
| Giannis Antetokounmpo | 2022-23 | 56.0% | 31.1 |
| Giannis Antetokounmpo | 2024-25 | 56.6% | 30.4 |
| Giannis Antetokounmpo | 2023-24 | 61.9% | 30.4 |
That's below every one of the 36 completed 30-point seasons since 2000-01. The lowest before were Luka's own, 11.1% last season and 15.9% in 2023-24, then Curry's 2020-21 at 19.4%.
Of note: Luka's never gotten to the basket less.
Here's every shot, last season and this one, on the court.
Every shot, last season and this
Luka's field-goal attempts as hexagons · size: share of the season's shots · colour: make rate in that zone against the whole NBA- At the rim11.1% of shots132 of 162 made, 81% · NBA 67%
- Short mid-range29.9% of shots228 of 435 made, 52% · NBA 44%
- Long mid-range11.4% of shots79 of 166 made, 48% · NBA 41%
- Corner threes3.1% of shots8 of 45 made, 18% · NBA 39%
- Above-the-break threes44.5% of shots246 of 649 made, 38% · NBA 35%
- At the rim8.4% of shots20 of 25 made, 80% · NBA 66%
- Short mid-range26.0% of shots43 of 77 made, 56% · NBA 44%
- Long mid-range11.5% of shots16 of 34 made, 47% · NBA 41%
- Corner threes5.1% of shots6 of 15 made, 40% · NBA 36%
- Above-the-break threes49.0% of shots59 of 145 made, 41% · NBA 34%
Show the numbers
| Season | Zone | Made | Shots | Share of shots | NBA % |
|---|---|---|---|---|---|
| 2025-26 | At the rim | 132 | 162 | 11.1% | 67.3% |
| 2025-26 | Short mid-range | 228 | 435 | 29.9% | 44.4% |
| 2025-26 | Long mid-range | 79 | 166 | 11.4% | 41.2% |
| 2025-26 | Corner threes | 8 | 45 | 3.1% | 38.7% |
| 2025-26 | Above-the-break threes | 246 | 649 | 44.5% | 35.0% |
| 2026-27 | At the rim | 20 | 25 | 8.4% | 65.9% |
| 2026-27 | Short mid-range | 43 | 77 | 26.0% | 43.9% |
| 2026-27 | Long mid-range | 16 | 34 | 11.5% | 40.7% |
| 2026-27 | Corner threes | 6 | 15 | 5.1% | 36.1% |
| 2026-27 | Above-the-break threes | 59 | 145 | 49.0% | 34.3% |
Flip Figure 8 to 2026-27: the share of shots at the rim falls from 11.1% to 8.4%, and threes go from 47.6% of Luka's shots to 54.1%.
Same shots, average shooter
People say that's because Luka can't get to the rim anymore. pbpstats gives every shot the chance an average NBA player makes it, from where it was taken and how, so Luka's 296 shots can be handed to an average shooter.
The same shots: 24.6 points a game for an average player, 29.4 for Luka
Luka's 296 field-goal attempts of 2026-27 · free throws not countedPoints a game from these 296 shots
Effective field-goal %
Show the numbers
| Value | |
|---|---|
| Average NBA player, same shots, points a game | 24.6 |
| Luka, points a game from those shots | 29.4 |
| Luka, effective FG% away from the rim | 57.7% |
| Whole NBA, effective FG%, every shot | 53.2% |
From the same shots, an average NBA player scores 24.6 points a game; Luka scores 29.4. That's 4.9 more, free throws not counted. Away from the rim Luka's effective field-goal percentage, which counts a three as one and a half makes, is 58%. The whole NBA, layups and dunks included, is at 53%.
It isn't the best shot-making ever, though. Per shot, Luka is 8th of the 83 seasons of 28 or more a game since 2000-01, and Kevin Durant's 2022-23 is top. The new part is this diet at this volume.
When [Luka] has it going, it's pick your poison, because [Luka] can just make any shot.
Shot-making: Luka is 8th, not 1st
effective FG% minus what an average player would shoot on the same shots, percentage points · seasons of 28+ a game since 2000-01Show the numbers
| Player | Season | Points a game | eFG% | Expected eFG% | Shot-making |
|---|---|---|---|---|---|
| Kevin Durant | 2022-23 | 29.1 | 61.4 | 48.0 | +13.5 |
| Nikola Jokić | 2024-25 | 29.6 | 62.7 | 51.5 | +11.2 |
| Stephen Curry | 2015-16 | 30.1 | 63.0 | 52.1 | +10.8 |
| Stephen Curry | 2022-23 | 29.4 | 61.4 | 50.7 | +10.7 |
| Shaquille O'Neal | 2000-01 | 28.7 | 57.2 | 47.3 | +9.8 |
| Stephen Curry | 2020-21 | 32.0 | 60.5 | 50.9 | +9.6 |
| Kevin Durant | 2021-22 | 29.9 | 57.0 | 48.0 | +9.0 |
| Luka Dončić | 2026-27 | 39.0 | 59.0 | 50.5 | +8.6 |
| Shai Gilgeous-Alexander | 2025-26 | 31.1 | 59.7 | 52.2 | +7.5 |
| Joel Embiid | 2022-23 | 33.1 | 57.3 | 50.3 | +7.0 |
| Luka Dončić | 2023-24 | 33.9 | 57.3 | 51.0 | +6.3 |
| Luka Dončić | 2022-23 | 32.4 | 56.0 | 49.8 | +6.2 |
Where the extra 5.5 came from
Last season Luka scored 33.5 a game. This season it's 39.0.
From 33.5 to 39.0: mostly threes
points a game, 2025-26 to 2026-27, split by how they were scored · the axis starts at 30Show the numbers
| Points a game | |
|---|---|
| 2025-26 | 33.48 |
| Threes | +4.34 |
| Free throws | +1.72 |
| Twos | -0.55 |
| 2026-27 | 39 |
Threes are 4.3 of the 5.5. Luka is taking a game, up from 10.8, and making 40.6%, up from 36.6%. Most come off Luka's own dribble: made threes with no assist went from 2.5 a game to 3.6.
Two of them were half-court heaves, 2 from 2, on 21 October and 6 November. Without them it's 63 of 158, 39.9%.
More minutes and a faster team explain only about 0.9 of the 5.5: Luka has gone from 74.3 possessions a game to 76.4, and at last season's scoring rate that's 0.9 points.
We live on a spaceship, and we're going at the speed of light at all times when [Luka]'s on the court.
The LeBron question
It isn't only LeBron James leaving for the 76ers. Last March, with LeBron on the roster, Luka scored 37.5 a game in 16 games.
March 2026: 37.7 a game next to LeBron
Luka's points, every game of March 2026 · teal: LeBron James playedWith LeBron: 37.7 a game
Show the numbers
| Date | Opponent | Points | LeBron played |
|---|---|---|---|
| 2026-03-01 | SAC | 28 | yes |
| 2026-03-03 | NOP | 27 | yes |
| 2026-03-05 | DEN | 27 | yes |
| 2026-03-06 | IND | 44 | no |
| 2026-03-08 | NYK | 35 | no |
| 2026-03-10 | MIN | 31 | no |
| 2026-03-12 | CHI | 51 | yes |
| 2026-03-14 | DEN | 30 | yes |
| 2026-03-16 | HOU | 36 | yes |
| 2026-03-18 | HOU | 40 | yes |
| 2026-03-19 | MIA | 60 | yes |
| 2026-03-21 | ORL | 33 | yes |
| 2026-03-23 | DET | 32 | yes |
| 2026-03-25 | IND | 43 | yes |
| 2026-03-27 | BRK | 41 | yes |
| 2026-03-31 | CLE | 42 | yes |
In the 13 games next to LeBron last March, Luka was already scoring 37.7.
Not everything counts
Some of this can't be counted yet.
- 12 games: a small season, 12 of 82.
- Free throws: 115 of 133 this season, 86%, against 78.0% last season and 78.6% at Luka's best before. A 78% shooter makes 115 or more of 133 about once in 100 tries.
- Turnovers: 4.8 a game, a career high; the old high was 4.5 in 2021-22.
- No rim data before 2000-01: pbpstats' shot locations start there, so there's no rim comparison with Jordan or Wilt.
A 78% free-throw shooter makes 115 of 133 about once in 100
a hundred shooters who make 78.0% of free throws, each taking 133 · the lit one makes 115 or more115+ of 133 0.9%, about 1 in 109
Show the numbers
| Free throws | |
|---|---|
| 2026-27 | 115 of 133, 86.5% |
| 2025-26 | 78.0% |
| Best season before | 2023-24, 78.6% |
| Chance of 115+ of 133 at 78.0% | 0.9% |
Show the numbers
| Season | Turnovers a game |
|---|---|
| 2018-19 | 3.4 |
| 2019-20 | 4.3 |
| 2020-21 | 4.3 |
| 2021-22 | 4.5 |
| 2022-23 | 3.6 |
| 2023-24 | 4.0 |
| 2024-25 | 3.6 |
| 2025-26 | 4.0 |
| 2026-27 | 4.8 |
Some of this is a hot streak, and 12 games can't say how much. I'll count it again at the All-Star break.
Every game so far, with a line to drag.
Over 37.5: 7/12 games
Show the numbers
| Date (US) | Opponent | Points | Rebounds | Assists | Minutes |
|---|---|---|---|---|---|
| 2026-10-21 | v GSW | 28 | 8 | 7 | 29:42 |
| 2026-10-23 | v LAC | 23 | 6 | 7 | 37:05 |
| 2026-10-25 | at UTA | 52 | 8 | 10 | 38:26 |
| 2026-10-27 | v POR | 41 | 5 | 9 | 36:45 |
| 2026-10-30 | at GSW | 37 | 7 | 5 | 37:21 |
| 2026-11-01 | v TOR | 45 | 15 | 6 | 35:17 |
| 2026-11-02 | v MIA | 42 | 7 | 13 | 35:38 |
| 2026-11-04 | at SAC | 40 | 9 | 7 | 35:08 |
| 2026-11-06 | v POR | 53 | 5 | 5 | 38:09 |
| 2026-11-09 | at ATL | 32 | 8 | 10 | 39:23 |
| 2026-11-11 | at MIL | 32 | 5 | 5 | 32:20 |
| 2026-11-15 | at PHO | 43 | 3 | 9 | 35:44 |
Summary
- Points a game
- 33.52025-2639.02026-27, 3rd ever
- True shooting
- 66.0%Luka66.9%Curry 2015-16
- Shots at the rim
- 8.4%Luka24.9%Curry 2015-16
The working
Definitions, sources and when the numbers were read
- Window
- Luka's 12 games of 2026-27, to 15 November (US time); Luka missed 2 of the Lakers' first 14 games. Every other season is a whole NBA regular season. Read 17 November 2026.
- The circles
- Volume: 35 or more points a game, to one decimal as Basketball-Reference prints it (Jordan's 1987-88, 34.98, is in). Efficiency: 30 or more a game at 65% true shooting or better. All-round: 30 points, 5 rebounds and 5 assists a game, each to one decimal, from Basketball-Reference's season pages (regular season; a traded player's whole-season row), with true shooting from its advanced pages. NBA only. Baylor's 1961-62 (48 games) is under the leaders' minimum and is added by hand from Baylor's page.
- True shooting
- Points ÷ (2 × (field-goal attempts + 0.44 × free-throw attempts)), as Basketball-Reference and StatMuse print it.
- Usage
- Basketball-Reference's usage rate: the share of a team's plays a player ends with a shot, free throws or a turnover while on the court. 40.2% is after 12 games (B-Ref had 40.1% after 11).
- At the rim
- pbpstats' AtRim shots (roughly 4 feet and in) over all field-goal attempts, from Luka's 296 shots this season (pbpstats get-shots, the same count as Basketball-Reference). The 36 other seasons: every one since 2000-01 with 30+ a game and 40+ games, from pbpstats' season totals.
- Same shots
- pbpstats' shot quality is the chance an average NBA player makes a shot like it, from its spot and type. Expected points = the sum of shot quality × the shot's value, divided by games. Shot-making = effective FG% minus pbpstats' expected effective FG%. Derived.
- The extra 5.5
- Basketball-Reference season totals, a game: threes made × 3, free throws made, twos made × 2. Possessions are pbpstats' offensive possessions a game (74.3 to 76.4), at last season's 45.0 points per 100. Threes "off the dribble": made threes with no assist (pbpstats).
- Free throws
- The binomial chance of 115 or more makes from 133 for a shooter at 78.0% (last season, 2025-26). Derived.
- LeBron, March 2026
- Luka's 16 March games, split by whether LeBron James played (both Basketball-Reference game logs, read 16 November 2026).
- Sources
- Basketball-Reference, Luka Dončić; 2026-27 game log; points a game leaders; usage leaders; season per-game and advanced pages. StatMuse, 30-point seasons by true shooting; StatMuse, 30-7-7 seasons. pbpstats.com (season totals and shots). Dan Devine, Yahoo Sports, 5 November 2026. JJ Redick to AP, 3 November 2026. ESPN on the March run.
- From the video
- The pictures at the top are frames from our video, “Luka Dončić is mixing all three” (NBA Stories, November 2026). Its player cut-outs are from ESPN and Basketball-Reference headshots; the quotes are credited on the frame.
- Not in this article
- Defence, playoff seasons, the ABA, and prices.
- Sources and terms
- Every source Punt uses, with its licence, is on Credits. The terms are defined in the Glossary, and the methodology page sets out where every number comes from and the rules it follows.