Seven 40-point games in four seasons, then 11 in one
every 40-point game in the NBL regular season, 2020-21 to 2026-27 so far · one ball eachShow the numbers
| Date | Player | Club | Opponent | Points | Rebounds | Assists |
|---|---|---|---|---|---|---|
| 2021-04-17 | Casper Ware | Sydney Kings | CNS | 40 | 2 | 3 |
| 2022-04-23 | Tahjere McCall | Cairns Taipans | BRI | 42 | 4 | 10 |
| 2022-12-18 | Mitchell Creek | South East Melbourne Phoenix | SYD | 46 | 10 | 1 |
| 2022-12-18 | Derrick Walton Jr | Sydney Kings | SEM | 45 | 4 | 10 |
| 2023-01-04 | Dejan Vasiljevic | Sydney Kings | SEM | 42 | 6 | 5 |
| 2023-01-27 | Bryce Cotton | Perth Wildcats | ILL | 40 | 7 | 4 |
| 2023-12-01 | Bryce Cotton | Perth Wildcats | SYD | 41 | 5 | 7 |
| 2024-11-09 | Chris Goulding | Melbourne United | PER | 46 | 2 | 2 |
| 2024-11-17 | James Batemon | Brisbane Bullets | PER | 51 | 4 | 3 |
| 2024-12-01 | Bryce Cotton | Perth Wildcats | NZL | 59 | 3 | 7 |
| 2024-12-06 | Bryce Cotton | Perth Wildcats | ILL | 40 | 4 | 4 |
| 2024-12-08 | Bryce Cotton | Perth Wildcats | ADL | 49 | 5 | 4 |
| 2024-12-14 | Bryce Cotton | Perth Wildcats | CNS | 44 | 3 | 6 |
| 2024-12-30 | Jaylen Adams | Sydney Kings | ADL | 41 | 5 | 2 |
| 2025-01-05 | Bryce Cotton | Perth Wildcats | NZL | 41 | 2 | 5 |
| 2025-01-13 | Chris Goulding | Melbourne United | NZL | 42 | 4 | 3 |
| 2025-01-24 | Jaylen Adams | Sydney Kings | ADL | 43 | 4 | 7 |
| 2025-02-07 | Bryce Cotton | Perth Wildcats | ADL | 49 | 3 | 7 |
| 2025-10-18 | Bryce Cotton | Adelaide 36ers | CNS | 53 | 2 | 5 |
| 2025-11-16 | Bryce Cotton | Adelaide 36ers | CNS | 41 | 1 | 8 |
| 2025-12-04 | Quentin Peterson | Illawarra Hawks | SEM | 42 | 5 | 4 |
| 2025-12-19 | Jack McVeigh | Cairns Taipans | NZL | 47 | 8 | 3 |
| 2026-01-22 | Kendric Davis | Sydney Kings | TAS | 40 | 2 | 8 |
| 2026-01-30 | Jack McVeigh | Cairns Taipans | TAS | 40 | 8 | 2 |
| 2026-02-14 | Bryce Cotton | Adelaide 36ers | NZL | 42 | 4 | 4 |
| 2026-10-03 | Cole Anthony | Melbourne United | CNS | 40 | 4 | 1 |
| 2026-10-10 | Sam Mennenga | NZ Breakers | PER | 40 | 18 | 5 |
The short version
- The NBL had 7 40-point games in the four regular seasons from 2020-21 to 2023-24, then 11 in 2024-25 alone. Regular season only. Bryce Cotton has 11 of the 27.
- Teams score 5.8 more points a game than in 2020-21, and about 4.0 of them come from a faster game. Possessions a team-game: 79.5 in 2020-21, 83.2 in 2025-26.
- The shots barely moved: about one in five is still from mid-range, 21.4% then and 22.4% now. Finishing at the rim went from 56.6% to 60.6%.
Why this was worth a look
Scoring is up everywhere.
- NBL: 7 40-point games in four seasons, then 11 in one.
- NBA: a record 203 40-point games in 2022-23. The old record was 142, from 1961-62.
So I wanted to know whether basketball offence has actually been solved, or whether something else changed.

The maths campThrees, layups, nothing in between
The oldheadsDefence isn't what it was
What actually changedThe game sped up
Two theories
- The maths: take threes, take layups and almost never shoot from in between.
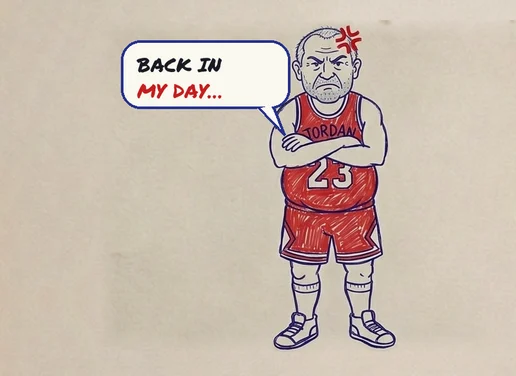
- Defence has fallen off: the oldheads' version, back in their day nobody scored 40.
Both can be tested. The maths changes where the shots come from. A worse defence or a faster game changes how many possessions there are and what each one is worth.
If it's the mathsthe shots move
Fewer shots from in between. Tested in Figure 2.
The shots never changed
Split every NBL shot into threes, shots at the rim and everything in between. In 2020-21, 38.5% were threes, 40.2% at the rim and 21.4% from mid-range. In 2025-26: 39.5%, 38.0% and 22.4%. The NBL did not follow the maths.
About one in five NBL shots is from mid-range, the same as in 2020-21
every NBL regular-season shot, by where it was taken · mid-range share at the endShow the numbers
| Season | Shots | Threes | At the rim | Mid-range |
|---|---|---|---|---|
| 2020-21 | 22616 | 38.5% | 40.2% | 21.4% |
| 2021-22 | 19772 | 39.8% | 39.3% | 21.0% |
| 2022-23 | 20196 | 39.8% | 39.8% | 20.4% |
| 2023-24 | 21002 | 36.9% | 43.1% | 20.0% |
| 2024-25 | 21053 | 40.3% | 39.7% | 20.0% |
| 2025-26 | 23990 | 39.5% | 38.0% | 22.4% |
| 2026-27 (so far) | 4207 | 43.3% | 36.4% | 20.3% |
The game got faster
A team had 79.5 possessions a game in 2020-21 and 83.2 in 2025-26, nearly four more. Each possession was also worth a little more: 107.4 points per 100 possessions then, 109.7 now, with a high of 111.8 in 2024-25. Of the 5.8 extra points a game, about 4.0 came from the faster game and 1.9 from more points per possession.
An NBL team gets 3.7 more possessions a game than in 2020-21
per team-game, regular season · the dashed step is the season so farPossessions a gameper team
Points per 100 possessionsper team
+5.8 points a game, 2020-21 to 2025-26
more possessions more points per possession
Show the numbers
| Season | Team-games | Points | Possessions | Points per 100 possessions | Free-throw attempts |
|---|---|---|---|---|---|
| 2020-21 | 324 | 85.4 | 79.5 | 107.4 | 17.2 |
| 2021-22 | 280 | 84.5 | 80.9 | 104.4 | 18.9 |
| 2022-23 | 278 | 88.1 | 82.3 | 107.0 | 20.5 |
| 2023-24 | 280 | 90.6 | 83.4 | 108.6 | 22.9 |
| 2024-25 | 290 | 92.9 | 83.1 | 111.8 | 21.6 |
| 2025-26 | 330 | 91.2 | 83.2 | 109.7 | 20.9 |
| 2026-27 (so far) | 58 | 93.7 | 83.0 | 112.8 | 20.9 |
The earlier piece More points, same threes found the threes did not move and left pace out. Counting the possessions answers the question it left open.
And better at the rim
The points per possession came from close in. Players made 56.6% of their shots at the rim in 2020-21 and 60.6% in 2025-26, and 63.6% so far in 2026-27. Free throws rose too, from 17.2 attempts a team-game to 20.9.
Shots at the rim: 56.6% made in 2020-21, 60.6% in 2025-26
share of shots within 2 metres of the hoop that went in, regular seasonShow the numbers
| Season | At-the-rim % | Mid-range % | Three-point % |
|---|---|---|---|
| 2020-21 | 56.6% | 39.8% | 34.7% |
| 2021-22 | 57.5% | 38.2% | 32.4% |
| 2022-23 | 59.2% | 39.4% | 34.5% |
| 2023-24 | 57.6% | 40.8% | 33.8% |
| 2024-25 | 59.5% | 40.9% | 35.0% |
| 2025-26 | 60.6% | 41.8% | 33.1% |
| 2026-27 (so far) | 63.6% | 42.8% | 34.2% |
The NBA, for scale
The NBA plays a much faster game. In 2025-26 an NBA team had 101.6 possessions a game against 83.2 in the NBL, and attempted 36.8 threes against 28.7. Per possession the gap is small: 113.3 points per 100 in the NBA, 109.7 in the NBL.
Per possession, the NBL is 3.6 points per 100 behind the NBA
per team-game, 2025-26 · NBL regular season, NBA every gamePoints a game
Possessions a game
Points per 100 possessions
Threes attempted a game
Show the numbers
| Per team-game | NBL | NBA |
|---|---|---|
| Points | 91.2 | 115.1 |
| Possessions | 83.2 | 101.6 |
| Points per 100 possessions | 109.7 | 113.3 |
| Threes attempted | 28.7 | 36.8 |
What this doesn't tell you
Possessions are an estimate from the box score, and the zones come from where the shot chart puts each shot, so a shot right on the line can land on either side. 2026-27 is 29 games old. The NBA record is the league's own, published count, not Punt's.
either side
To scale: at the rim is within 2 metres of the hoop, the arc is 6.75 metres out.
So who solved it?
The NBA solved offence with a spreadsheet: more threes, fewer shots from in between. The NBL kept the same shots and started running, and its players got better at finishing. Neither is defence falling off on its own. Next I want to see whether the fastest NBL teams are the ones scoring most per possession, or just the ones scoring most.
Did the shots move out of mid-range?
No21.4% of shots then, 22.4% nowDid the game speed up?
Yes+3.7 possessions a game, about 4.0 of the 5.8 extra pointsDid players finish better?
Yes56.6% at the rim then, 60.6% nowDid defence just fall off?
Not on its ownthe rise is the pace and the finishingThe working
- Seasons
- NBL regular seasons 2020-21 to 2026-27 (in progress), 1840 team-games. A season is stored under the year it ends.
- Regular season
- A game counts when it is within the first G games of both clubs, G being the fewest games any club played that season. The feed labels some finals as rounds, so the round name alone is not enough.
- Team-game
- One club's player rows in one game, added together.
- Possessions
- Field-goal attempts + 0.44 × free-throw attempts − offensive rebounds + turnovers, per team-game. Points per 100 possessions is points divided by that, times 100.
- The split
- The 5.8-point rise from 2020-21 to 2025-26: extra possessions at the old rate (4.0), plus the new number of possessions at the higher rate (1.9). Rounding leaves 0.1 over.
- Shot zones
- 132,836 regular-season shots from the shot chart. A three is the feed's own label. At the rim is a two within 2 metres of the hoop, on a 28 by 15 metre court with the hoop 1.575 metres in from the baseline. Mid-range is every other two.
- 40-point games
- Regular season only, so 2024-25 counts 11. One more came in its finals.
- NBA
- 2025-26, every game in Punt's database (1322), so finals are in. The record of 203 40-point games in 2022-23 is the published count (NBA.com, May 2023).
- Read
- 14 October 2026, from Punt's database.
- Sources
- The NBL's own record is at nbl.com.au; the NBA record is from NBA.com.
- Not in this article
- Pace by club, who the 40-point games came against, and prices.
- Sources and terms
- Every source Punt uses, with its licence, is on Credits. The terms are defined in the Glossary, and the methodology page sets out where every number comes from and the rules it follows.